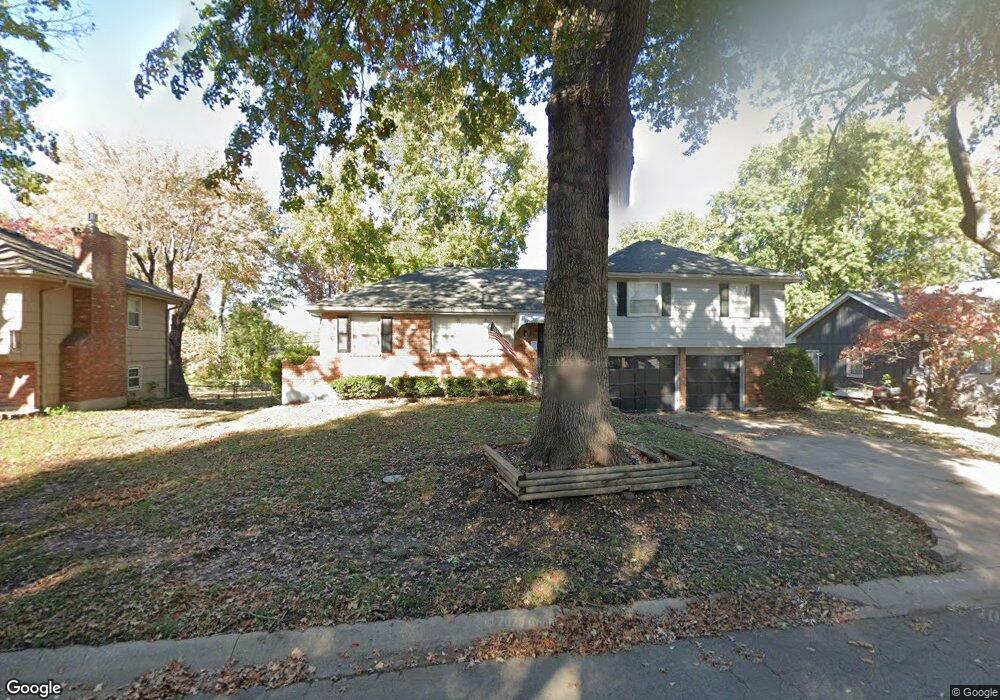
11812 E 61st Terrace Kansas City, MO 64133
Little Blue Valley NeighborhoodEstimated Value: $222,674 - $253,000
3
Beds
2
Baths
1,398
Sq Ft
$170/Sq Ft
Est. Value
About This Home
This home is located at 11812 E 61st Terrace, Kansas City, MO 64133 and is currently estimated at $237,169, approximately $169 per square foot. 11812 E 61st Terrace is a home located in Jackson County with nearby schools including Norfleet Elementary School, Raytown Central Middle School, and Raytown South High School.
Ownership History
Date
Name
Owned For
Owner Type
Purchase Details
Closed on
Aug 14, 2019
Sold by
Kansas City Property Group Ii Llc
Bought by
Conrex Ml Sma 2019 01 Operating Co Llc
Current Estimated Value
Purchase Details
Closed on
Nov 19, 2008
Sold by
Woodley Jimmy L and Woodley Robery
Bought by
J & R Real Estate Llc
Home Financials for this Owner
Home Financials are based on the most recent Mortgage that was taken out on this home.
Original Mortgage
$45,250
Interest Rate
5.99%
Mortgage Type
Future Advance Clause Open End Mortgage
Purchase Details
Closed on
Sep 22, 2008
Sold by
Miller Sharon
Bought by
Woodley Jimmy L and Woodley Robery
Home Financials for this Owner
Home Financials are based on the most recent Mortgage that was taken out on this home.
Original Mortgage
$45,250
Interest Rate
5.99%
Mortgage Type
Future Advance Clause Open End Mortgage
Create a Home Valuation Report for This Property
The Home Valuation Report is an in-depth analysis detailing your home's value as well as a comparison with similar homes in the area
Home Values in the Area
Average Home Value in this Area
Purchase History
| Date | Buyer | Sale Price | Title Company |
|---|---|---|---|
| Conrex Ml Sma 2019 01 Operating Co Llc | -- | Clear Title Nationwide Inc | |
| Kansas City Property Group Ii Llc | -- | Clear Title Nationwide Inc | |
| J & R Real Estate Llc | -- | First American Title Ins Co | |
| J & R Real Estate Llc | -- | First American Title Ins Co | |
| Woodley Jimmy L | -- | First American Title Ins Co |
Source: Public Records
Mortgage History
| Date | Status | Borrower | Loan Amount |
|---|---|---|---|
| Previous Owner | J & R Real Estate Llc | $45,250 |
Source: Public Records
Tax History Compared to Growth
Tax History
| Year | Tax Paid | Tax Assessment Tax Assessment Total Assessment is a certain percentage of the fair market value that is determined by local assessors to be the total taxable value of land and additions on the property. | Land | Improvement |
|---|---|---|---|---|
| 2025 | $2,597 | $27,640 | $6,521 | $21,119 |
| 2024 | $2,581 | $28,698 | $6,943 | $21,755 |
| 2023 | $2,581 | $28,697 | $5,445 | $23,252 |
| 2022 | $1,955 | $20,900 | $6,422 | $14,478 |
| 2021 | $1,955 | $20,900 | $6,422 | $14,478 |
| 2020 | $1,883 | $19,892 | $6,422 | $13,470 |
| 2019 | $1,848 | $19,892 | $6,422 | $13,470 |
| 2018 | $1,395 | $15,079 | $2,229 | $12,850 |
| 2017 | $1,395 | $15,079 | $2,229 | $12,850 |
| 2016 | $1,204 | $13,112 | $3,718 | $9,394 |
| 2014 | $1,174 | $12,730 | $3,610 | $9,120 |
Source: Public Records
Map
Nearby Homes
- 11600 E 62nd St
- 11701 E 61st St
- 11601 E 62nd St
- 11707 E 60th Terrace
- 11715 E 60th St
- 6100 Englewood Ave
- 11914 E 59th Terrace
- 6322 Norwood Ct
- 6012 Woodside Ave
- 6004 S Claremont Ave
- 11918 E 59th St
- 5933 Sterling Ave
- 5828 Woodson Rd
- 5923 Larson Ave
- 6317 Harvard Ave
- 6009 Marion Ave
- 11312 E 59th St
- 6407 Harvard Ave
- 11500 E 58th St
- 12417 E 58th Terrace
- 11826 E 61st Terrace
- 11806 E 61st Terrace
- 11813 E 61st St
- 11817 E 61st St
- 11832 E 61st Terrace
- 11800 E 61st Terrace
- 11815 E 61st Terrace
- 11809 E 61st St
- 11809 E 61st Terrace
- 11821 E 61st St
- 11819 E 61st Terrace
- 11807 E 61st Terrace
- 11805 E 61st St
- 11825 E 61st St
- 11712 E 61st Terrace
- 11806 E 61st St
- 11812 E 61st St
- 6120 Moats Dr
- 11717 E 61st Terrace
- 11816 E 61st St