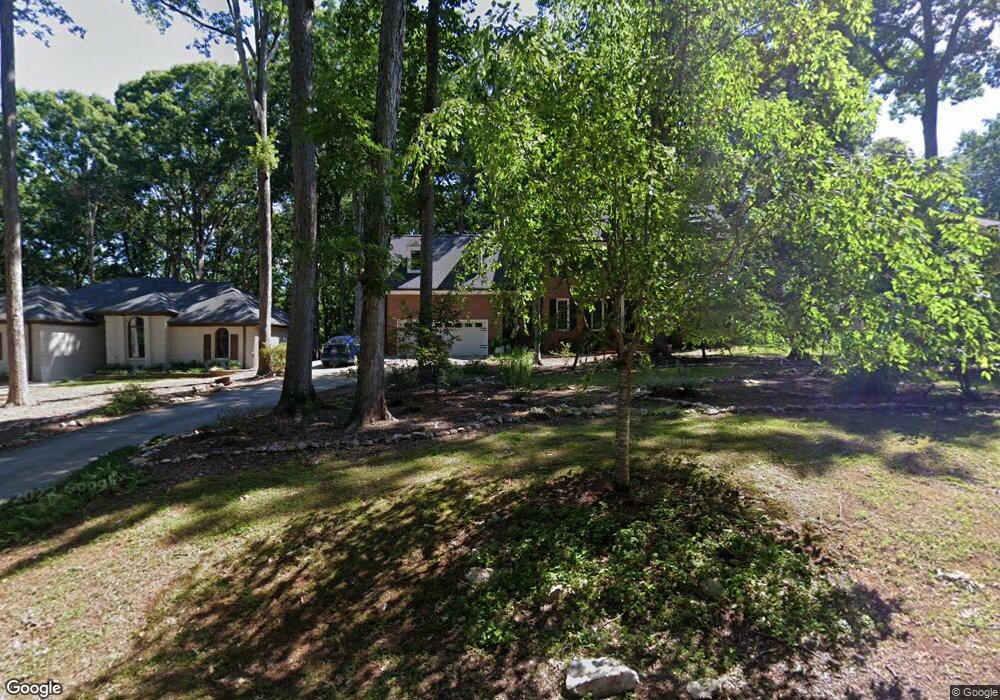
11812 Mountbatten Way Raleigh, NC 27613
Estimated Value: $604,000 - $737,000
4
Beds
3
Baths
3,000
Sq Ft
$225/Sq Ft
Est. Value
About This Home
This home is located at 11812 Mountbatten Way, Raleigh, NC 27613 and is currently estimated at $673,627, approximately $224 per square foot. 11812 Mountbatten Way is a home located in Wake County with nearby schools including West Millbrook Middle School, Leesville Road High School, and The Franciscan School.
Ownership History
Date
Name
Owned For
Owner Type
Purchase Details
Closed on
Sep 8, 2020
Sold by
Marshall Leslie and Harrigan Richard
Bought by
Marshall Leslie
Current Estimated Value
Home Financials for this Owner
Home Financials are based on the most recent Mortgage that was taken out on this home.
Original Mortgage
$356,500
Outstanding Balance
$316,370
Interest Rate
2.9%
Mortgage Type
New Conventional
Estimated Equity
$357,257
Purchase Details
Closed on
Aug 7, 2015
Sold by
Metke Nelson W and Metke Mary L
Bought by
Marshall Leslie
Home Financials for this Owner
Home Financials are based on the most recent Mortgage that was taken out on this home.
Original Mortgage
$321,300
Interest Rate
4.04%
Mortgage Type
New Conventional
Purchase Details
Closed on
Jun 29, 1990
Bought by
Metke Ii Nelson W and Metke Mary L
Create a Home Valuation Report for This Property
The Home Valuation Report is an in-depth analysis detailing your home's value as well as a comparison with similar homes in the area
Home Values in the Area
Average Home Value in this Area
Purchase History
| Date | Buyer | Sale Price | Title Company |
|---|---|---|---|
| Marshall Leslie | -- | None Available | |
| Marshall Leslie | $378,000 | Attorney | |
| Metke Ii Nelson W | $189,500 | -- |
Source: Public Records
Mortgage History
| Date | Status | Borrower | Loan Amount |
|---|---|---|---|
| Open | Marshall Leslie | $356,500 | |
| Closed | Marshall Leslie | $321,300 |
Source: Public Records
Tax History Compared to Growth
Tax History
| Year | Tax Paid | Tax Assessment Tax Assessment Total Assessment is a certain percentage of the fair market value that is determined by local assessors to be the total taxable value of land and additions on the property. | Land | Improvement |
|---|---|---|---|---|
| 2025 | $4,017 | $624,983 | $150,000 | $474,983 |
| 2024 | $3,901 | $624,983 | $150,000 | $474,983 |
| 2023 | $3,310 | $422,007 | $70,000 | $352,007 |
| 2022 | $3,068 | $422,007 | $70,000 | $352,007 |
| 2021 | $2,985 | $422,007 | $70,000 | $352,007 |
| 2020 | $2,936 | $422,007 | $70,000 | $352,007 |
| 2019 | $3,110 | $378,361 | $104,000 | $274,361 |
| 2018 | $2,859 | $378,361 | $104,000 | $274,361 |
| 2017 | $2,710 | $378,361 | $104,000 | $274,361 |
| 2016 | $2,655 | $378,361 | $104,000 | $274,361 |
| 2015 | $2,400 | $342,656 | $104,000 | $238,656 |
| 2014 | $2,275 | $342,656 | $104,000 | $238,656 |
Source: Public Records
Map
Nearby Homes
- 11804 Mountbatten Way
- 11913 Eagle Bluff Cir
- 11953 Eagle Cliff Ct
- 5528 Hawthorne Park
- 12304 Whartons Way
- 8717 Little Deer Ln
- 2729 Sunnystone Way
- 5240 Indigo Moon Way
- 5020 Red Cedar Rd
- 2409 Loring Ct
- 2612 Scarlet Sage Ct
- 5009 Wood Valley Dr
- 11209 Sedgefield Dr
- 5965 Dunbarton Way
- 10729 Winding Wood Trail
- 4817 Wood Valley Dr
- 12316 Amoretto Way
- 5216 Sutter Way
- Harlow Plan at Bayberry
- 5308 Roan Mountain Place
- 11816 Mt Batten Way
- 11816 Mountbatten Way
- 11808 Mountbatten Way
- 11808 Mountbatten Way
- 11817 Mountbatten Way
- 11820 Mountbatten Way
- 11800 Mountbatten Way
- 11824 Mountbatten Way
- 11901 Eagle Bluff Cir
- 11905 Eagle Bluff Cir
- 11945 Eagle Bluff Cir
- 11909 Eagle Bluff Cir
- 5509 N Hawthorne Way
- 5513 N Hawthorne Way
- 5505 N Hawthorne Way
- 5501 N Hawthorne Way
- 5425 N Hawthorne Way
- 12428 Whartons Way
- 5421 N Hawthorne Way
- 5336 Old Willard Dr