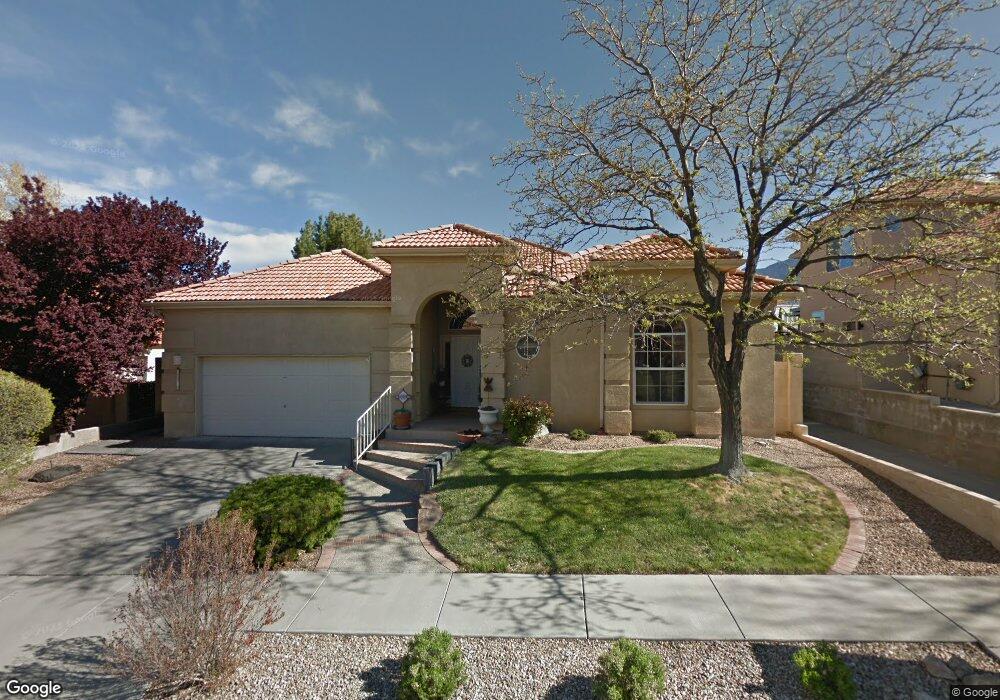
11815 Caribou Ave NE Albuquerque, NM 87111
Antelope Run NeighborhoodEstimated Value: $483,000 - $578,000
3
Beds
2
Baths
2,076
Sq Ft
$256/Sq Ft
Est. Value
About This Home
This home is located at 11815 Caribou Ave NE, Albuquerque, NM 87111 and is currently estimated at $531,723, approximately $256 per square foot. 11815 Caribou Ave NE is a home located in Bernalillo County with nearby schools including Georgia O'Keefe Elementary School, Eisenhower Middle School, and La Cueva High School.
Ownership History
Date
Name
Owned For
Owner Type
Purchase Details
Closed on
Feb 8, 2024
Sold by
Janice Charles W and Janice Marie
Bought by
Peterson Brenda R and Peterson Dannel L
Current Estimated Value
Purchase Details
Closed on
Jul 14, 2004
Sold by
Causey Janice Marie
Bought by
Causey Janice Marie and Trust B Of The Charles W & Janice Marie
Purchase Details
Closed on
Jun 13, 2001
Sold by
Causey Janice M and Causey Charles W
Bought by
Charles W & Janice Marie Causey Family R
Purchase Details
Closed on
May 25, 2001
Sold by
Krage Michael W and Krage Diedre A
Bought by
Causey Janice M
Purchase Details
Closed on
Oct 5, 2000
Sold by
Fosnes Carl A and Fosnes Janice A
Bought by
Krage Michael W and Krage Diedre A
Home Financials for this Owner
Home Financials are based on the most recent Mortgage that was taken out on this home.
Original Mortgage
$175,200
Interest Rate
7.99%
Create a Home Valuation Report for This Property
The Home Valuation Report is an in-depth analysis detailing your home's value as well as a comparison with similar homes in the area
Home Values in the Area
Average Home Value in this Area
Purchase History
| Date | Buyer | Sale Price | Title Company |
|---|---|---|---|
| Peterson Brenda R | -- | First American Title Insurance | |
| Causey Janice Marie | -- | -- | |
| Charles W & Janice Marie Causey Family R | -- | Fidelity National Title Ins | |
| Causey Janice M | -- | Fidelity National Title Ins | |
| Krage Michael W | -- | Stewart Title |
Source: Public Records
Mortgage History
| Date | Status | Borrower | Loan Amount |
|---|---|---|---|
| Previous Owner | Krage Michael W | $175,200 |
Source: Public Records
Tax History Compared to Growth
Tax History
| Year | Tax Paid | Tax Assessment Tax Assessment Total Assessment is a certain percentage of the fair market value that is determined by local assessors to be the total taxable value of land and additions on the property. | Land | Improvement |
|---|---|---|---|---|
| 2025 | $4,483 | $157,118 | $24,331 | $132,787 |
| 2024 | $4,483 | $112,263 | $28,889 | $83,374 |
| 2023 | $4,401 | $108,994 | $28,048 | $80,946 |
| 2022 | $4,246 | $105,819 | $27,231 | $78,588 |
| 2021 | $4,096 | $102,737 | $26,438 | $76,299 |
| 2020 | $4,021 | $99,745 | $25,668 | $74,077 |
| 2019 | $3,896 | $96,840 | $24,920 | $71,920 |
| 2018 | $3,750 | $96,840 | $24,920 | $71,920 |
| 2017 | $3,627 | $94,020 | $24,195 | $69,825 |
| 2016 | $3,515 | $88,623 | $22,806 | $65,817 |
| 2015 | $86,043 | $86,043 | $22,142 | $63,901 |
| 2014 | $3,292 | $83,537 | $21,498 | $62,039 |
| 2013 | -- | $81,105 | $20,872 | $60,233 |
Source: Public Records
Map
Nearby Homes
- 11829 Caribou Ave NE
- 11908 Oryx Place NE
- 11628 Woodmar Ln NE
- 6225 Peachtree Place NE
- 6112 Innsbrook Ct NE
- 6109 Chamblee Ct NE
- 11425 Malaguena Ln NE
- 11315 Penfield Ln NE
- 12405 Royal Oak Ct NE
- 11216 Woodmar Ln NE
- 12501 Mckay Way NE
- 11419 Costa Del Sol NE
- 11108 Double Eagle NE
- 12616 Northern Sky Ave NE
- 5712 Papaya Place NE
- 12724 Sandia Ridge Place NE
- 12612 Desert Marigold Ln NE
- 12800 Northern Sky Ave NE
- 5801 Lowell St NE Unit 24B
- 11041 Academy Ridge Rd NE
- 11809 Caribou Ave NE
- 11817 Caribou Ave NE
- 11821 Caribou Ave NE
- 11805 Caribou Ave NE
- 11812 Caribou Ave NE
- 11808 Caribou Ave NE
- 11816 Caribou Ave NE
- 11825 Caribou Ave NE
- 11801 Caribou Ave NE
- 11801 Ibex Ave NE
- 11805 Ibex Ave NE
- 11808 Baccarat Ln NE
- 11809 Ibex Ave NE
- 6405 Elk Horn Dr NE
- 11824 Caribou Ave NE
- 11804 Baccarat Ln NE
- 11815 Ibex Ave NE
- 11816 Baccarat Ln NE
- 6401 Elk Horn Dr NE
- 11901 Caribou Ave NE