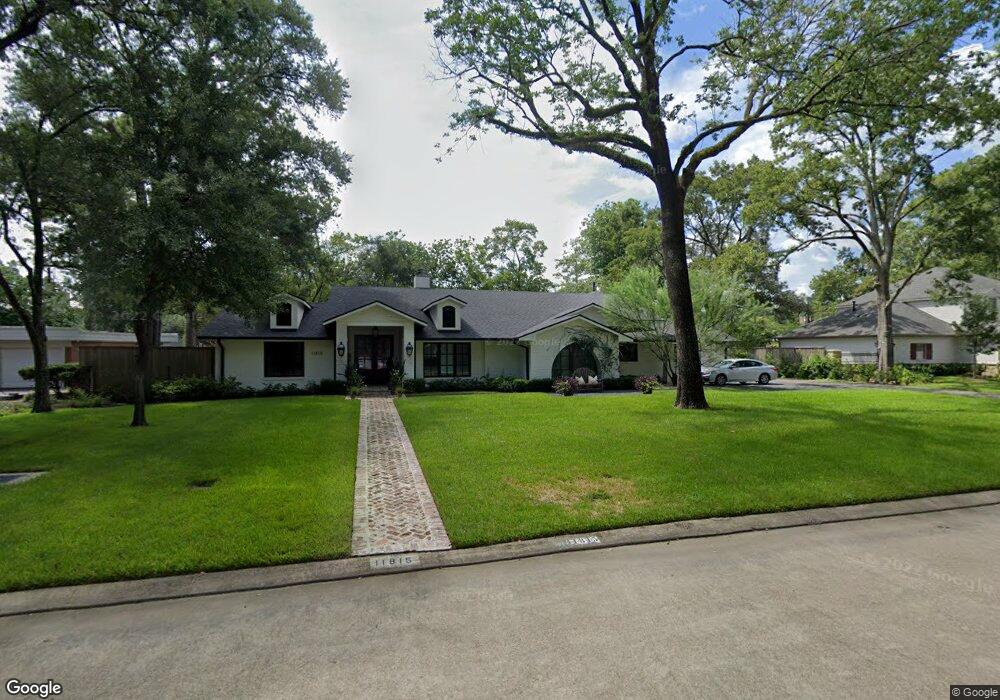
11815 Wink Rd Houston, TX 77024
Memorial NeighborhoodEstimated Value: $2,157,000 - $2,867,000
4
Beds
6
Baths
5,480
Sq Ft
$468/Sq Ft
Est. Value
About This Home
This home is located at 11815 Wink Rd, Houston, TX 77024 and is currently estimated at $2,564,102, approximately $467 per square foot. 11815 Wink Rd is a home located in Harris County with nearby schools including Frostwood Elementary School, Memorial Middle, and Memorial High School.
Ownership History
Date
Name
Owned For
Owner Type
Purchase Details
Closed on
Nov 30, 2018
Sold by
Lovell Marilyn L
Bought by
Lovell Jeffery C and Lovell Ann H
Current Estimated Value
Home Financials for this Owner
Home Financials are based on the most recent Mortgage that was taken out on this home.
Original Mortgage
$1,500,000
Outstanding Balance
$1,321,532
Interest Rate
4.8%
Mortgage Type
Stand Alone First
Estimated Equity
$1,242,570
Purchase Details
Closed on
Aug 7, 2007
Sold by
The Marilyn L Lovell Trust
Bought by
Lovell Jeffery C and Lovell Ann H
Home Financials for this Owner
Home Financials are based on the most recent Mortgage that was taken out on this home.
Original Mortgage
$200,000
Interest Rate
6.69%
Mortgage Type
Seller Take Back
Purchase Details
Closed on
Jun 21, 2005
Sold by
Brown Mary Ann Lacy and Brown Leslie Cletus
Bought by
Lovell Jeffrey C and Lovell Ann H
Create a Home Valuation Report for This Property
The Home Valuation Report is an in-depth analysis detailing your home's value as well as a comparison with similar homes in the area
Home Values in the Area
Average Home Value in this Area
Purchase History
| Date | Buyer | Sale Price | Title Company |
|---|---|---|---|
| Lovell Jeffery C | -- | None Available | |
| Lovell Jeffery C | -- | None Available | |
| Lovell Jeffrey C | -- | Alamo Title Company |
Source: Public Records
Mortgage History
| Date | Status | Borrower | Loan Amount |
|---|---|---|---|
| Open | Lovell Jeffery C | $1,500,000 | |
| Previous Owner | Lovell Jeffery C | $200,000 |
Source: Public Records
Tax History Compared to Growth
Tax History
| Year | Tax Paid | Tax Assessment Tax Assessment Total Assessment is a certain percentage of the fair market value that is determined by local assessors to be the total taxable value of land and additions on the property. | Land | Improvement |
|---|---|---|---|---|
| 2025 | $35,876 | $2,249,106 | $1,320,000 | $929,106 |
| 2024 | $35,876 | $2,138,486 | $1,237,500 | $900,986 |
| 2023 | $35,876 | $2,027,284 | $1,155,000 | $872,284 |
| 2022 | $47,889 | $2,011,936 | $1,155,000 | $856,936 |
| 2021 | $45,536 | $1,865,104 | $1,155,000 | $710,104 |
| 2020 | $46,278 | $1,847,002 | $1,155,000 | $692,002 |
| 2019 | $52,360 | $2,000,000 | $1,155,000 | $845,000 |
| 2018 | $19,030 | $1,555,400 | $1,155,000 | $400,400 |
| 2017 | $33,748 | $1,290,000 | $1,155,000 | $135,000 |
| 2016 | $31,556 | $1,335,266 | $1,155,000 | $180,266 |
| 2015 | $21,017 | $1,104,266 | $924,000 | $180,266 |
| 2014 | $21,017 | $1,104,266 | $924,000 | $180,266 |
Source: Public Records
Map
Nearby Homes
- 11722 Claywood St
- 31 Knipp Rd
- 318 Knipp Rd
- 11711 Memorial Dr Unit 570
- 11711 Memorial Dr Unit 55
- 11711 Memorial Dr Unit 21
- 11711 Memorial Dr Unit 565
- 11711 Memorial Dr Unit 695
- 11711 Memorial Dr Unit 644
- 11711 Memorial Dr Unit 285
- 11711 Memorial Dr Unit 371
- 11711 Memorial Dr Unit 129
- 11711 Memorial Dr Unit 251
- 11711 Memorial Dr Unit 573
- 11711 Memorial Dr Unit 545
- 11711 Memorial Dr Unit 276
- 11711 Memorial Dr Unit 13
- 11711 Memorial Dr Unit 367
- 45 Patti Lynn Ln
- 345 Knipp Rd
- 11807 Wink Rd
- 11821 Wink Rd
- 11814 Longleaf Ln
- 11818 Longleaf Ln
- 11810 Longleaf Ln
- 11814 Wink Rd
- 11822 Longleaf Ln
- 11808 Wink Rd
- 11820 Wink Rd
- 11806 Longleaf Ln
- 11827 Wink Rd
- 11803 Wink Rd
- 11826 Longleaf Ln
- 11802 Longleaf Ln
- 11826 Wink Rd
- 11800 Wink Rd
- 11815 Durrette Dr
- 11809 Durrette Dr
- 11821 Durrette Dr
- 11833 Wink Rd