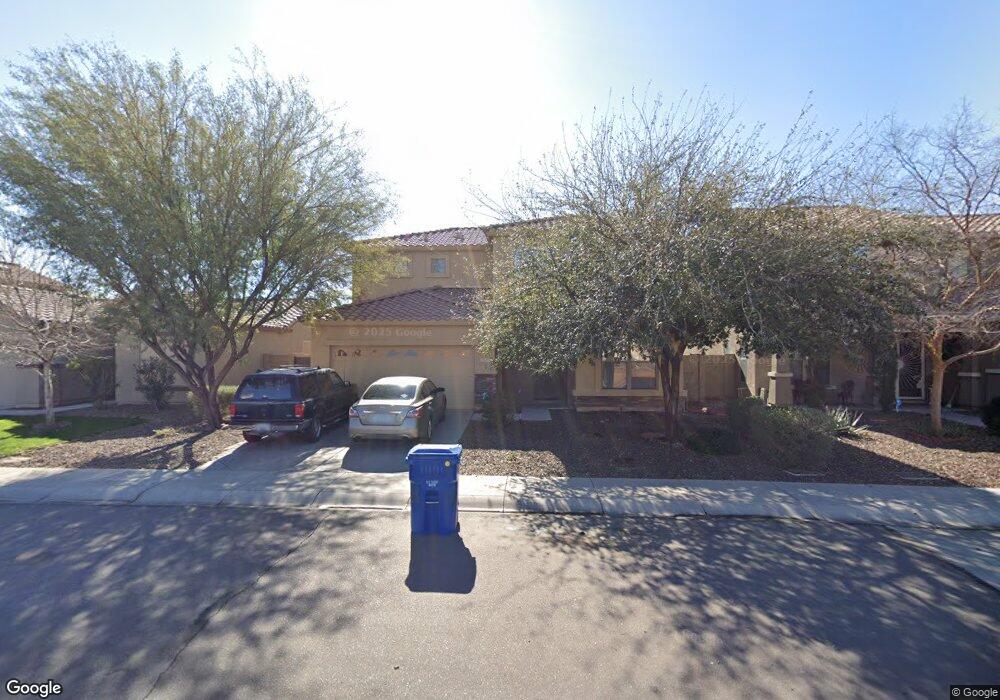
11817 W Mohave St Avondale, AZ 85323
Coldwater Springs NeighborhoodEstimated Value: $336,420 - $418,000
--
Bed
3
Baths
2,051
Sq Ft
$192/Sq Ft
Est. Value
About This Home
This home is located at 11817 W Mohave St, Avondale, AZ 85323 and is currently estimated at $393,355, approximately $191 per square foot. 11817 W Mohave St is a home located in Maricopa County with nearby schools including Estrella Vista Elementary School, La Joya Community High School, and Academies of Math and Science Avondale.
Ownership History
Date
Name
Owned For
Owner Type
Purchase Details
Closed on
Oct 14, 2005
Sold by
Elenes Maria T
Bought by
Elenes Juan P
Current Estimated Value
Home Financials for this Owner
Home Financials are based on the most recent Mortgage that was taken out on this home.
Original Mortgage
$130,000
Outstanding Balance
$69,011
Interest Rate
5.63%
Mortgage Type
New Conventional
Estimated Equity
$324,344
Purchase Details
Closed on
Jul 15, 2005
Sold by
Ryland Homes Of Arizona Inc
Bought by
Elenes Juan P and Elenes Maria T
Home Financials for this Owner
Home Financials are based on the most recent Mortgage that was taken out on this home.
Original Mortgage
$80,000
Interest Rate
5.51%
Mortgage Type
New Conventional
Purchase Details
Closed on
Jul 8, 2005
Sold by
The Ryland Group Inc
Bought by
Ryland Homes Of Arizona Inc
Home Financials for this Owner
Home Financials are based on the most recent Mortgage that was taken out on this home.
Original Mortgage
$80,000
Interest Rate
5.51%
Mortgage Type
New Conventional
Create a Home Valuation Report for This Property
The Home Valuation Report is an in-depth analysis detailing your home's value as well as a comparison with similar homes in the area
Home Values in the Area
Average Home Value in this Area
Purchase History
| Date | Buyer | Sale Price | Title Company |
|---|---|---|---|
| Elenes Juan P | -- | Title Security Agency Of Az | |
| Elenes Juan P | $245,550 | -- | |
| Ryland Homes Of Arizona Inc | $245,550 | -- |
Source: Public Records
Mortgage History
| Date | Status | Borrower | Loan Amount |
|---|---|---|---|
| Open | Elenes Juan P | $130,000 | |
| Closed | Elenes Juan P | $80,000 |
Source: Public Records
Tax History Compared to Growth
Tax History
| Year | Tax Paid | Tax Assessment Tax Assessment Total Assessment is a certain percentage of the fair market value that is determined by local assessors to be the total taxable value of land and additions on the property. | Land | Improvement |
|---|---|---|---|---|
| 2025 | $1,804 | $13,979 | -- | -- |
| 2024 | $1,646 | $13,313 | -- | -- |
| 2023 | $1,646 | $29,610 | $5,920 | $23,690 |
| 2022 | $1,640 | $21,770 | $4,350 | $17,420 |
| 2021 | $1,586 | $20,310 | $4,060 | $16,250 |
| 2020 | $1,526 | $18,760 | $3,750 | $15,010 |
| 2019 | $1,523 | $16,430 | $3,280 | $13,150 |
| 2018 | $1,392 | $15,230 | $3,040 | $12,190 |
| 2017 | $1,292 | $13,880 | $2,770 | $11,110 |
| 2016 | $1,210 | $12,510 | $2,500 | $10,010 |
| 2015 | $1,192 | $11,920 | $2,380 | $9,540 |
Source: Public Records
Map
Nearby Homes
- 1802 S 118th Dr
- 11742 W Chase Ln
- 11952 W Overlin Ln
- 11765 W Overlin Ln
- 1402 S 118th Dr
- 11623 W Cocopah St
- 12038 W Davis Ln
- 12002 W Calle Hermosa Ln
- 12160 W Chase Ln
- 12010 W Calle Hermosa Ln
- 12022 W Belmont Dr
- 12172 W Davis Ln
- 11713 W Rio Vista Ln
- 11594 W Mountain View Dr
- 1213 S 121st Ln
- 12217 W Davis Ln
- 1402 S 122nd Ln
- 2117 S 114th Ave
- 1814 S 123rd Dr
- 11383 W Pima St
- 11813 W Mohave St
- 11821 W Mohave St
- 11809 W Mohave St
- 11825 W Mohave St
- 11805 W Mohave St
- 11829 W Mohave St
- 1801 S 118th Dr
- 11801 W Mohave St
- 1805 S 118th Dr
- 11783 W Mohave St
- 11820 W Hopi St
- 11816 W Hopi St
- 11824 W Hopi St
- 11795 W Apache St
- 11812 W Hopi St
- 11828 W Hopi St
- 11808 W Hopi St
- 1706 S 118th Dr
- 1710 S 118th Dr
- 11779 W Mohave St