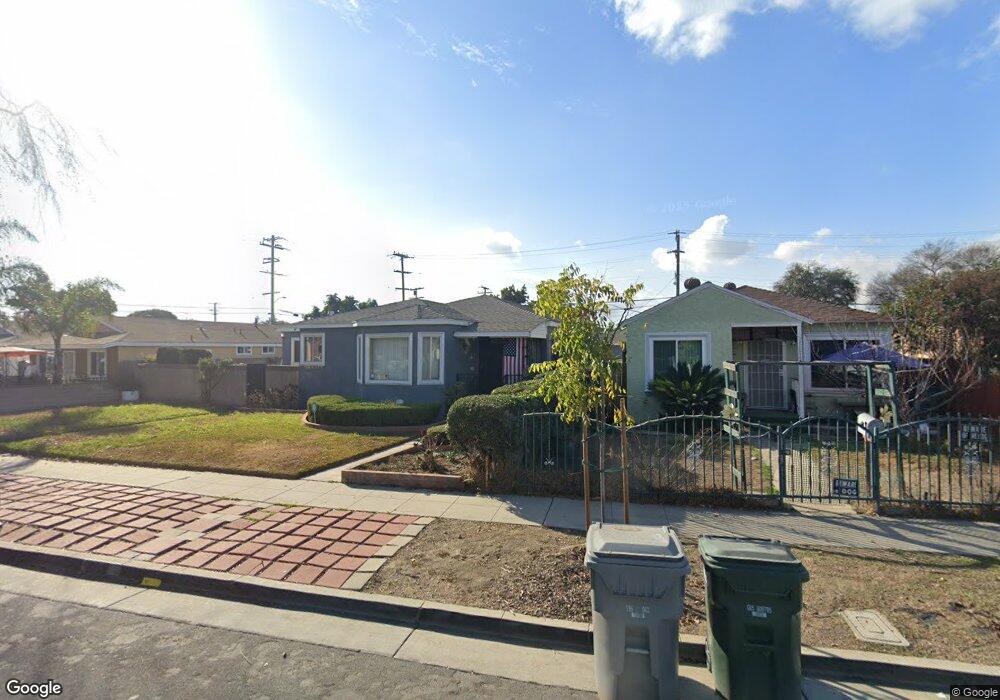
11819 Harris Ave Lynwood, CA 90262
Estimated Value: $639,000 - $766,000
3
Beds
1
Bath
1,256
Sq Ft
$547/Sq Ft
Est. Value
About This Home
This home is located at 11819 Harris Ave, Lynwood, CA 90262 and is currently estimated at $686,755, approximately $546 per square foot. 11819 Harris Ave is a home located in Los Angeles County with nearby schools including Mark Twain Elementary School, Lynwood Middle School, and Marco Antonio Firebaugh High School.
Ownership History
Date
Name
Owned For
Owner Type
Purchase Details
Closed on
Aug 26, 2013
Sold by
Lampkin Charlene and Charlene Lampkin Living Trust
Bought by
Lampkin Charlene and Charlene Lampkn Living Trust 2
Current Estimated Value
Home Financials for this Owner
Home Financials are based on the most recent Mortgage that was taken out on this home.
Original Mortgage
$406,500
Interest Rate
2.8%
Mortgage Type
Reverse Mortgage Home Equity Conversion Mortgage
Purchase Details
Closed on
Aug 9, 2007
Sold by
Lampkin Charlene
Bought by
Lampkin Charlene and The Lampkin Living Trust 2000
Home Financials for this Owner
Home Financials are based on the most recent Mortgage that was taken out on this home.
Original Mortgage
$106,000
Interest Rate
6.73%
Mortgage Type
New Conventional
Purchase Details
Closed on
Sep 26, 2000
Sold by
Lampkin Charlene
Bought by
Lampkin Charlene and Charlene Lampkin Living Trust
Create a Home Valuation Report for This Property
The Home Valuation Report is an in-depth analysis detailing your home's value as well as a comparison with similar homes in the area
Home Values in the Area
Average Home Value in this Area
Purchase History
| Date | Buyer | Sale Price | Title Company |
|---|---|---|---|
| Lampkin Charlene | -- | None Available | |
| Lampkin Charlene | -- | Stewart Title Of Ca Inc | |
| Lampkin Charlene | -- | Stewart Title Of Ca Inc | |
| Lampkin Charlene | -- | -- |
Source: Public Records
Mortgage History
| Date | Status | Borrower | Loan Amount |
|---|---|---|---|
| Closed | Lampkin Charlene | $406,500 | |
| Closed | Lampkin Charlene | $106,000 |
Source: Public Records
Tax History Compared to Growth
Tax History
| Year | Tax Paid | Tax Assessment Tax Assessment Total Assessment is a certain percentage of the fair market value that is determined by local assessors to be the total taxable value of land and additions on the property. | Land | Improvement |
|---|---|---|---|---|
| 2025 | $1,626 | $74,867 | $39,552 | $35,315 |
| 2024 | $1,626 | $73,400 | $38,777 | $34,623 |
| 2023 | $1,614 | $71,962 | $38,017 | $33,945 |
| 2022 | $1,570 | $70,552 | $37,272 | $33,280 |
| 2021 | $1,523 | $69,170 | $36,542 | $32,628 |
| 2019 | $1,535 | $67,120 | $35,459 | $31,661 |
| 2018 | $1,347 | $65,805 | $34,764 | $31,041 |
| 2016 | $1,259 | $63,252 | $33,415 | $29,837 |
| 2015 | $1,238 | $62,303 | $32,914 | $29,389 |
| 2014 | $1,224 | $61,084 | $32,270 | $28,814 |
Source: Public Records
Map
Nearby Homes
- 4173 Agnes Ave
- 12120 Muriel Dr
- 4221 Alvada St
- 12029 2nd Ave
- 4276 Lavinia Ave
- 3955 Agnes Ave
- 4245 Lugo Ave
- 3886 Cortland St
- 4274 Walnut Ave
- 4296 Walnut Ave
- 1901 E Orchard St
- 4000 Platt Ave
- 12640 Antigua Ct
- 4296 Platt Ave
- 12623 Harris Ave
- 3805 Lugo Ave
- 4636 Cardwell St
- 3831 Walnut Ave
- 4523 Arlington Ave
- 4539 Arlington Ave
- 11821 Harris Ave
- 11815 Harris Ave
- 11827 Harris Ave
- 11811 Harris Ave
- 11805 Harris Ave
- 11904 Thorson Ave
- 11810 Thorson Ave
- 11910 Thorson Ave
- 11806 Thorson Ave
- 4169 Agnes Ave
- 4167 Agnes Ave
- 4171 Agnes Ave
- 4163 Agnes Ave
- 11818 Harris Ave
- 11822 Harris Ave
- 4154 Josephine St
- 11814 Harris Ave
- 4157 Agnes Ave
- 11824 Harris Ave
- 11812 Harris Ave