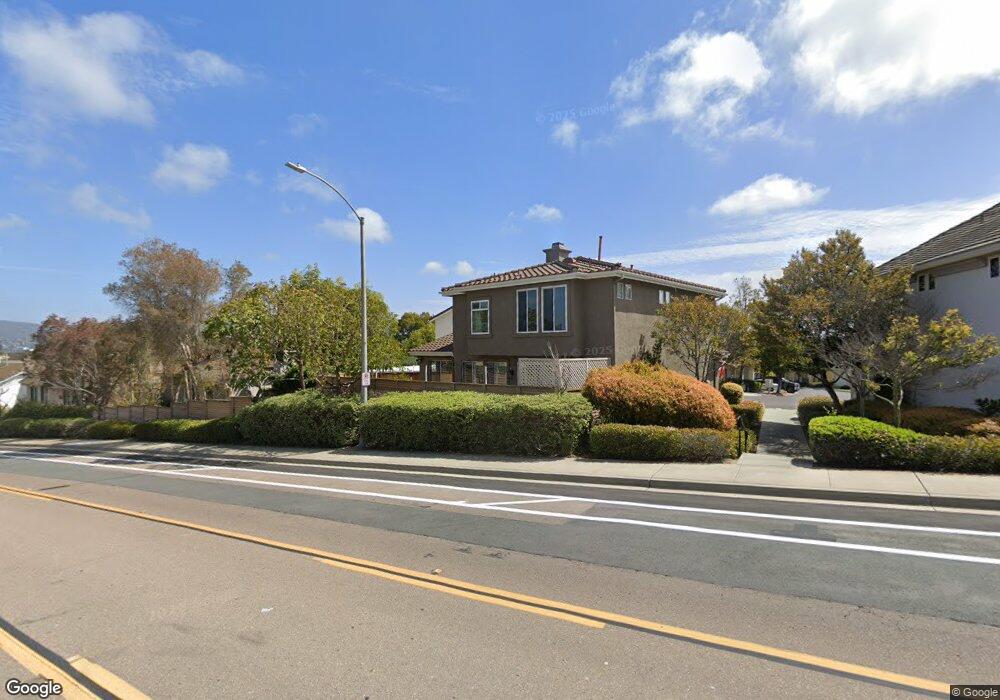
1182 Pacifica Place Unit 53 Encinitas, CA 92024
Central Encinitas NeighborhoodEstimated Value: $1,386,019 - $1,444,000
3
Beds
3
Baths
1,678
Sq Ft
$837/Sq Ft
Est. Value
About This Home
This home is located at 1182 Pacifica Place Unit 53, Encinitas, CA 92024 and is currently estimated at $1,404,255, approximately $836 per square foot. 1182 Pacifica Place Unit 53 is a home located in San Diego County with nearby schools including Park Dale Lane Elementary, Oak Crest Middle School, and La Costa Canyon High School.
Ownership History
Date
Name
Owned For
Owner Type
Purchase Details
Closed on
Jul 5, 2017
Sold by
Yim Kay
Bought by
Yim Kay and Gould Chelsea
Current Estimated Value
Purchase Details
Closed on
Oct 21, 2016
Sold by
Yim Kay
Bought by
Yim Kay
Home Financials for this Owner
Home Financials are based on the most recent Mortgage that was taken out on this home.
Original Mortgage
$270,000
Interest Rate
3.5%
Mortgage Type
New Conventional
Purchase Details
Closed on
Apr 17, 1999
Sold by
Yim Kay
Bought by
Yim Kay
Purchase Details
Closed on
Mar 5, 1998
Sold by
Green Valley Associates I Llc
Bought by
Yim Kay
Home Financials for this Owner
Home Financials are based on the most recent Mortgage that was taken out on this home.
Original Mortgage
$208,950
Interest Rate
6.84%
Mortgage Type
Purchase Money Mortgage
Create a Home Valuation Report for This Property
The Home Valuation Report is an in-depth analysis detailing your home's value as well as a comparison with similar homes in the area
Home Values in the Area
Average Home Value in this Area
Purchase History
| Date | Buyer | Sale Price | Title Company |
|---|---|---|---|
| Yim Kay | -- | None Available | |
| Yim Kay | -- | None Available | |
| Yim Kay | -- | Accommodation | |
| Yim Kay | -- | First American Title | |
| Yim Kay | -- | -- | |
| Yim Kay | $261,500 | Chicago Title Co |
Source: Public Records
Mortgage History
| Date | Status | Borrower | Loan Amount |
|---|---|---|---|
| Previous Owner | Yim Kay | $270,000 | |
| Previous Owner | Yim Kay | $208,950 |
Source: Public Records
Tax History
| Year | Tax Paid | Tax Assessment Tax Assessment Total Assessment is a certain percentage of the fair market value that is determined by local assessors to be the total taxable value of land and additions on the property. | Land | Improvement |
|---|---|---|---|---|
| 2025 | $6,378 | $409,461 | $166,475 | $242,986 |
| 2024 | $6,378 | $401,433 | $163,211 | $238,222 |
| 2023 | $6,255 | $393,562 | $160,011 | $233,551 |
| 2022 | $5,815 | $385,846 | $156,874 | $228,972 |
| 2021 | $6,107 | $378,282 | $153,799 | $224,483 |
| 2020 | $6,365 | $374,404 | $152,222 | $222,182 |
| 2019 | $6,222 | $367,064 | $149,238 | $217,826 |
| 2018 | $6,208 | $359,867 | $146,312 | $213,555 |
| 2017 | $6,196 | $352,812 | $143,444 | $209,368 |
| 2016 | $6,048 | $345,895 | $140,632 | $205,263 |
| 2015 | $6,016 | $340,700 | $138,520 | $202,180 |
| 2014 | $5,926 | $334,027 | $135,807 | $198,220 |
Source: Public Records
Map
Nearby Homes
- 444 N El Camino Real Unit 47
- 444 N El Camino Real Unit 48
- 444 N El Camino Real Unit SPC 42
- 444 N El Camino Real Unit 119
- 444 N El Camino Real Unit 23
- 444 N El Camino Real Unit 110
- 350 N El Camino Real Unit 78s
- 350 N El Camino Real Unit 72
- 598 Paloma Ct
- 1502 Vanessa Cir
- 1693 Honeysuckle Ct
- 623 Quail Gardens Ln
- 1615 Orchard Wood Rd
- 155 Rosebay Dr Unit 42
- 2072 Wandering Rd
- 2063 Wandering Rd
- 800 Encinitas Blvd Unit 104
- 731 Teaberry St Unit 4
- 1107 Catania Ct Unit 203
- 1402 Village View Rd
- 1186 Pacifica Place
- 1185 Pacifica Place
- 713 Pacifica Way
- 1158 Pacifica Place Unit 57
- 1157 Pacifica Place
- 1181 Pacifica Place
- 1177 Pacifica Place
- 1162 Pacifica Place
- 1174 Pacifica Place
- 1178 Pacifica Place Unit 54
- 746 Pacifica Way
- 1173 Pacifica Place
- 738 Pacifica Way
- 729 Pacifica Way
- 1108 Pacifica Place Unit 64
- 730 Pacifica Way
- 737 Pacifica Way
- 1109 Pacifica Place Unit 32
- 1121 Pacifica Place
- 1169 Pacifica Place
Your Personal Tour Guide
Ask me questions while you tour the home.