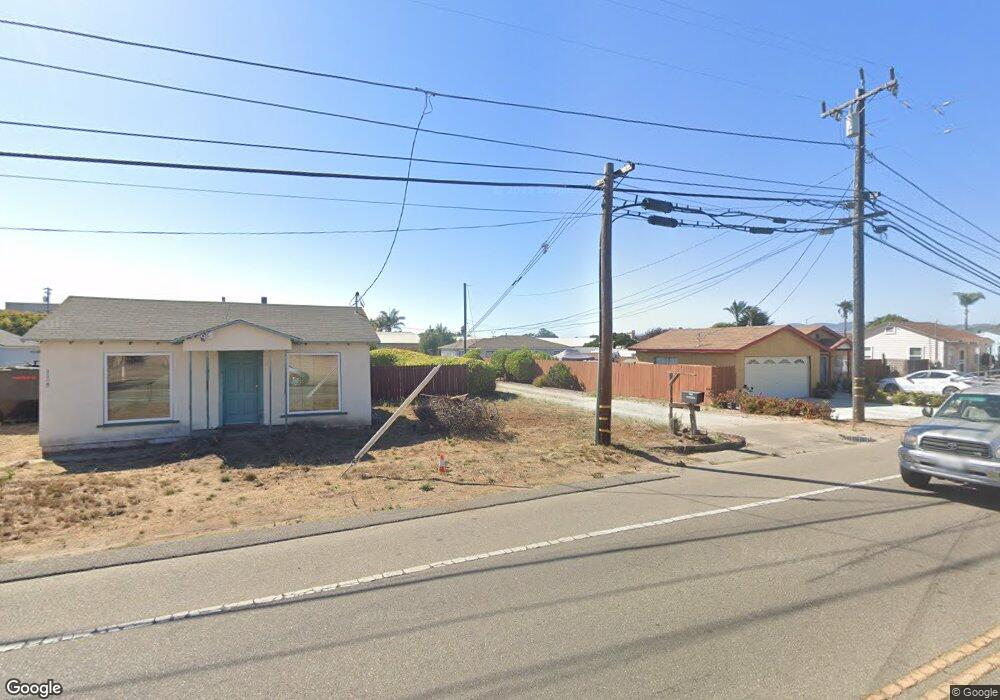
1182 S 13th St Grover Beach, CA 93433
Estimated Value: $681,000 - $808,000
3
Beds
2
Baths
1,216
Sq Ft
$593/Sq Ft
Est. Value
About This Home
This home is located at 1182 S 13th St, Grover Beach, CA 93433 and is currently estimated at $721,532, approximately $593 per square foot. 1182 S 13th St is a home located in San Luis Obispo County with nearby schools including Grover Beach Elementary School, Judkins Middle School, and Arroyo Grande High School.
Ownership History
Date
Name
Owned For
Owner Type
Purchase Details
Closed on
Jul 13, 2020
Sold by
Gillespie Robert W and Gillespie Lori A
Bought by
Gillespie Robert W and Gillespie Lori A
Current Estimated Value
Purchase Details
Closed on
Mar 25, 2014
Sold by
Lombardini Michael A and Lombardini Patricia M
Bought by
The Michael & Patricia Limbardini Family and Lombardini Patricia M
Purchase Details
Closed on
Jul 7, 2003
Sold by
Lombardini Michael A and Lombardini Patricia M
Bought by
Lombardini Michael A and Lombardini Patricia M
Home Financials for this Owner
Home Financials are based on the most recent Mortgage that was taken out on this home.
Original Mortgage
$111,000
Interest Rate
5.22%
Mortgage Type
Purchase Money Mortgage
Purchase Details
Closed on
Mar 3, 1994
Sold by
Lombardini Michael A and Banach Patricia M
Bought by
Lombardini Michael A and Banach Patricia M
Create a Home Valuation Report for This Property
The Home Valuation Report is an in-depth analysis detailing your home's value as well as a comparison with similar homes in the area
Home Values in the Area
Average Home Value in this Area
Purchase History
| Date | Buyer | Sale Price | Title Company |
|---|---|---|---|
| Gillespie Robert W | -- | None Available | |
| The Michael & Patricia Limbardini Family | -- | None Available | |
| Lombardini Michael A | -- | None Available | |
| Lombardini Michael A | -- | First American Title Company | |
| Lombardini Michael A | -- | -- |
Source: Public Records
Mortgage History
| Date | Status | Borrower | Loan Amount |
|---|---|---|---|
| Closed | Lombardini Michael A | $111,000 |
Source: Public Records
Tax History Compared to Growth
Tax History
| Year | Tax Paid | Tax Assessment Tax Assessment Total Assessment is a certain percentage of the fair market value that is determined by local assessors to be the total taxable value of land and additions on the property. | Land | Improvement |
|---|---|---|---|---|
| 2025 | $1,717 | $160,043 | $78,071 | $81,972 |
| 2024 | $1,702 | $156,906 | $76,541 | $80,365 |
| 2023 | $1,702 | $153,831 | $75,041 | $78,790 |
| 2022 | $1,674 | $150,816 | $73,570 | $77,246 |
| 2021 | $1,652 | $147,860 | $72,128 | $75,732 |
| 2020 | $1,633 | $146,345 | $71,389 | $74,956 |
| 2019 | $1,618 | $143,477 | $69,990 | $73,487 |
| 2018 | $1,596 | $140,665 | $68,618 | $72,047 |
| 2017 | $1,524 | $137,908 | $67,273 | $70,635 |
| 2016 | $1,418 | $135,204 | $65,954 | $69,250 |
| 2015 | $1,385 | $133,174 | $64,964 | $68,210 |
| 2014 | $1,303 | $130,566 | $63,692 | $66,874 |
Source: Public Records
Map
Nearby Homes
- 943 Huston St
- 948 Huston St
- 1180 Marbella Ct
- 1084 Baden Ave
- 1206 Capitola St
- 1211 Baden Ave
- 1207 Capitola St
- 1024 Baden Ave
- 978 Griffin St
- 1626 Monterey Ave
- 155 Lynne St
- 1154 Marseille Ct
- 1338 16th St
- 848 Mentone Ave
- 560 S 12th St
- 1157 Norswing Dr
- 651 Pershing Dr
- 604 S 8th St
- 0 Palace Ave Unit PI21196628
- 1610 16th St
- 1172 S 13th St
- 1180 S 13th St
- 1215 Messina Ct
- 1156 S 13th St
- 1156 S 13th St
- 1198 S 13th St
- 1218 Messina Ct
- 1192 S 13th St
- 1221 Messina Ct
- 1224 Messina Ct
- 1120 Bodega Ct
- 1141 Highland Way
- 1130 Bodega Ct
- 1131 Highland Way
- 1110 Bodega Ct
- 1231 Messina Ct
- 1253 Aberdeen Ct Unit 2
- 1239 Aberdeen Ct
- 1275 Aberdeen Ct Unit 3
- 1275 Aberdeen Ct