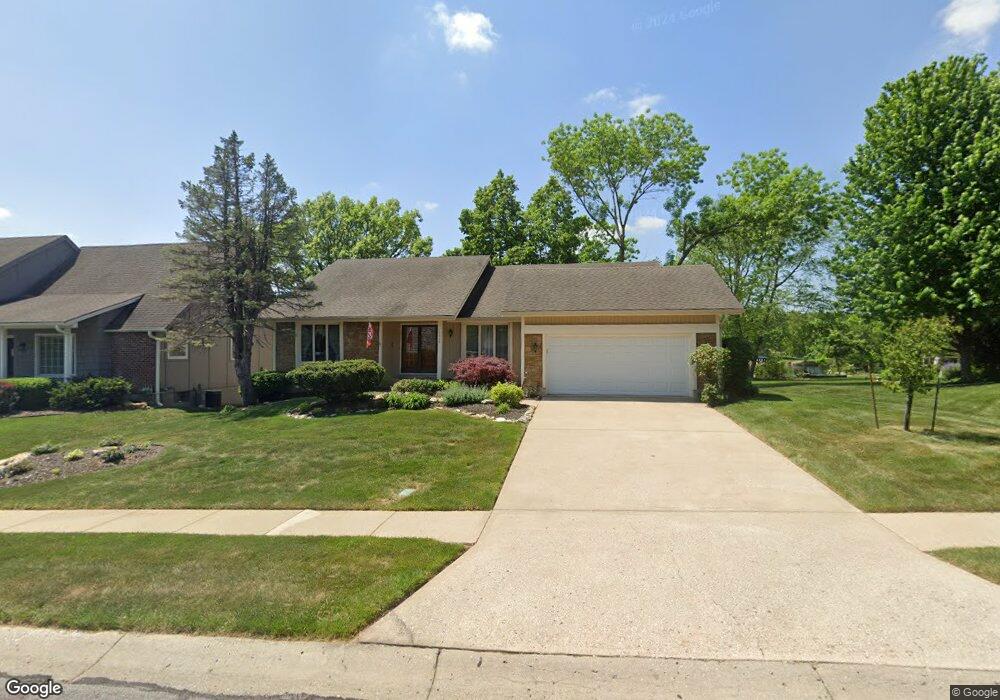
11820 Rosehill Rd Overland Park, KS 66210
Central Overland Park NeighborhoodEstimated Value: $462,577 - $487,000
4
Beds
3
Baths
2,604
Sq Ft
$183/Sq Ft
Est. Value
About This Home
This home is located at 11820 Rosehill Rd, Overland Park, KS 66210 and is currently estimated at $475,644, approximately $182 per square foot. 11820 Rosehill Rd is a home located in Johnson County with nearby schools including Walnut Grove Elementary School, Pioneer Trail Middle School, and Olathe East Sr High School.
Ownership History
Date
Name
Owned For
Owner Type
Purchase Details
Closed on
Apr 11, 2023
Sold by
Enrique Chaves Trust
Bought by
Enrique Chaves And Vilma P Chaves Trust
Current Estimated Value
Purchase Details
Closed on
Sep 24, 2010
Sold by
Chaves Enrique
Bought by
Chaves Enrique and Chaves Vilma P
Home Financials for this Owner
Home Financials are based on the most recent Mortgage that was taken out on this home.
Original Mortgage
$131,500
Interest Rate
3.91%
Mortgage Type
New Conventional
Purchase Details
Closed on
Aug 25, 2003
Sold by
Chaves Enrique and Chaves Vilma P
Bought by
Chaves Enrique and Chaves Vilma P
Home Financials for this Owner
Home Financials are based on the most recent Mortgage that was taken out on this home.
Original Mortgage
$144,200
Interest Rate
5.71%
Mortgage Type
Purchase Money Mortgage
Create a Home Valuation Report for This Property
The Home Valuation Report is an in-depth analysis detailing your home's value as well as a comparison with similar homes in the area
Home Values in the Area
Average Home Value in this Area
Purchase History
| Date | Buyer | Sale Price | Title Company |
|---|---|---|---|
| Enrique Chaves And Vilma P Chaves Trust | -- | None Listed On Document | |
| Chaves Enrique | -- | Clear Title Nationwide Inc | |
| Chaves Enrique | -- | -- |
Source: Public Records
Mortgage History
| Date | Status | Borrower | Loan Amount |
|---|---|---|---|
| Previous Owner | Chaves Enrique | $131,500 | |
| Previous Owner | Chaves Enrique | $144,200 |
Source: Public Records
Tax History Compared to Growth
Tax History
| Year | Tax Paid | Tax Assessment Tax Assessment Total Assessment is a certain percentage of the fair market value that is determined by local assessors to be the total taxable value of land and additions on the property. | Land | Improvement |
|---|---|---|---|---|
| 2024 | $4,995 | $45,988 | $11,885 | $34,103 |
| 2023 | $4,791 | $43,297 | $11,885 | $31,412 |
| 2022 | $4,464 | $39,491 | $11,885 | $27,606 |
| 2021 | $4,523 | $38,077 | $9,505 | $28,572 |
| 2020 | $4,229 | $35,581 | $7,311 | $28,270 |
| 2019 | $4,163 | $34,776 | $5,111 | $29,665 |
| 2018 | $3,886 | $32,223 | $5,111 | $27,112 |
| 2017 | $3,577 | $29,429 | $5,111 | $24,318 |
| 2016 | $3,301 | $27,842 | $5,111 | $22,731 |
| 2015 | $3,180 | $27,094 | $5,111 | $21,983 |
| 2013 | -- | $24,012 | $5,111 | $18,901 |
Source: Public Records
Map
Nearby Homes
- 12701 W 118th St
- 11696 Rosehill Rd
- 12908 W 118th Terrace
- 11812 Gillette St
- 11918 Westgate St
- 11915 Westgate St
- 12910 W 116th St
- 11838 Oakmont St
- The Timberland Plan at Riverstone Valley
- The Avalon Plan at Riverstone Valley
- The Rebecca Plan at Riverstone Valley
- The Haley Plan at Riverstone Valley
- The Hudson Plan at Riverstone Valley
- The Hansen Plan at Riverstone Valley
- 12707 W 122nd St
- 17313 Earnshaw St
- 17308 Earnshaw St
- 17044 Earnshaw St
- 17028 Earnshaw St
- 17100 Earnshaw St
- 11828 Rosehill Rd
- 12705 W 118th St
- 11827 Rosehill Rd
- 11805 Rosehill Rd
- 12709 W 118th St
- 12700 W 118th St
- 11809 Rosehill Rd
- 12711 W 118th St
- 12706 W 118th St
- 11821 Rosehill Rd
- 11701 Rosehill Rd
- 11815 Rosehill Rd
- 12715 W 118th St
- 12701 W 117th St
- 12710 W 118th St
- 11693 Rosehill Rd
- 12700 W 119th St
- 12703 W 117th St
- 11691 Rosehill Rd
- 11695 Rosehill Rd