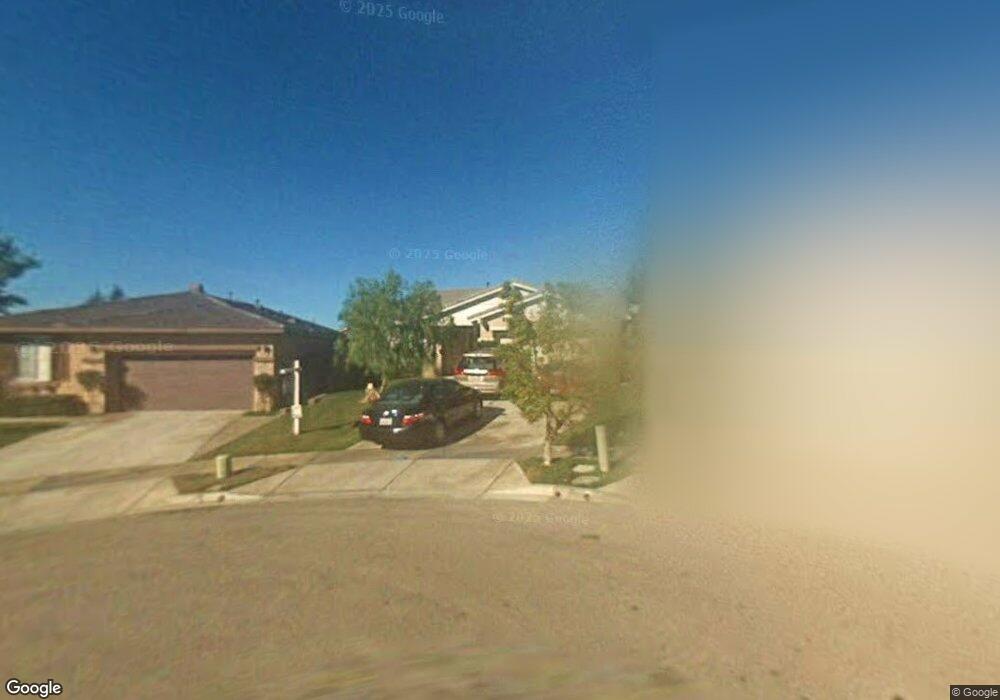
11826 Warwick Hills Ct Yucaipa, CA 92399
Estimated Value: $508,000 - $540,000
3
Beds
2
Baths
1,458
Sq Ft
$363/Sq Ft
Est. Value
About This Home
This home is located at 11826 Warwick Hills Ct, Yucaipa, CA 92399 and is currently estimated at $529,362, approximately $363 per square foot. 11826 Warwick Hills Ct is a home located in San Bernardino County with nearby schools including Chapman Heights Elementary, Park View Middle School, and Yucaipa High School.
Ownership History
Date
Name
Owned For
Owner Type
Purchase Details
Closed on
Mar 15, 2016
Sold by
Oxandaboure Frank and Oxandaboure Karyn K
Bought by
Oxandaboure Frank Oxandaboure and Oxandaboure Karyn
Current Estimated Value
Home Financials for this Owner
Home Financials are based on the most recent Mortgage that was taken out on this home.
Original Mortgage
$222,750
Outstanding Balance
$176,715
Interest Rate
3.72%
Mortgage Type
New Conventional
Estimated Equity
$352,647
Purchase Details
Closed on
Jan 29, 2015
Sold by
Oxandaboure Frank and Oxandaboure Karyn K
Bought by
The Frank Oxandaboure Jr & Karyn Oxandab
Purchase Details
Closed on
Dec 30, 2009
Sold by
Hale Steven D and Hale Tracy A
Bought by
Oxandaboure Frank and Oxandaboure Karyn K
Home Financials for this Owner
Home Financials are based on the most recent Mortgage that was taken out on this home.
Original Mortgage
$160,000
Interest Rate
4.68%
Mortgage Type
New Conventional
Purchase Details
Closed on
Apr 10, 2006
Sold by
Hale Cliff E and Hale Brenda K
Bought by
Hale Steven D and Hale Tracy A
Home Financials for this Owner
Home Financials are based on the most recent Mortgage that was taken out on this home.
Original Mortgage
$220,000
Interest Rate
6.29%
Mortgage Type
Fannie Mae Freddie Mac
Purchase Details
Closed on
Jul 1, 2005
Sold by
Hale Cliff E and Hale Brenda K
Bought by
Hale Cliff E and Hale Brenda K
Purchase Details
Closed on
Jul 19, 2001
Sold by
Kimmel Richard D
Bought by
Lobel Jeffrey S and Lobel Stephanie H
Home Financials for this Owner
Home Financials are based on the most recent Mortgage that was taken out on this home.
Original Mortgage
$134,400
Interest Rate
7.09%
Purchase Details
Closed on
Jul 18, 2001
Sold by
Lobel Jeffrey S and Lobel Stephanie H
Bought by
Hale Cliff E and Hale Brenda K
Home Financials for this Owner
Home Financials are based on the most recent Mortgage that was taken out on this home.
Original Mortgage
$134,400
Interest Rate
7.09%
Purchase Details
Closed on
Mar 24, 2000
Sold by
Kimmel Ronna S
Bought by
Kimmel Richard D
Home Financials for this Owner
Home Financials are based on the most recent Mortgage that was taken out on this home.
Original Mortgage
$161,658
Interest Rate
8.34%
Mortgage Type
FHA
Purchase Details
Closed on
Mar 3, 2000
Sold by
Osborne Development Corp
Bought by
Lobel Jeffrey S and Lobel Stephanie H
Home Financials for this Owner
Home Financials are based on the most recent Mortgage that was taken out on this home.
Original Mortgage
$161,658
Interest Rate
8.34%
Mortgage Type
FHA
Create a Home Valuation Report for This Property
The Home Valuation Report is an in-depth analysis detailing your home's value as well as a comparison with similar homes in the area
Home Values in the Area
Average Home Value in this Area
Purchase History
| Date | Buyer | Sale Price | Title Company |
|---|---|---|---|
| Oxandaboure Frank Oxandaboure | -- | Accommodation | |
| Oxandaboure Frank | -- | Wfg Title Company Of Ca | |
| The Frank Oxandaboure Jr & Karyn Oxandab | -- | None Available | |
| Oxandaboure Frank | $200,000 | Fidelity National Title Ie | |
| Hale Steven D | $275,000 | Fidelity Natl Title Ins Co | |
| Hale Cliff E | -- | Fidelity National Title Co | |
| Lobel Jeffrey S | -- | Fidelity National Title Ins | |
| Hale Cliff E | $168,000 | Fidelity National Title Ins | |
| Kimmel Richard D | -- | -- | |
| Lobel Jeffrey S | $163,000 | First American Title Ins |
Source: Public Records
Mortgage History
| Date | Status | Borrower | Loan Amount |
|---|---|---|---|
| Open | Oxandaboure Frank | $222,750 | |
| Closed | Oxandaboure Frank | $160,000 | |
| Previous Owner | Hale Steven D | $220,000 | |
| Previous Owner | Hale Cliff E | $134,400 | |
| Previous Owner | Lobel Jeffrey S | $161,658 |
Source: Public Records
Tax History Compared to Growth
Tax History
| Year | Tax Paid | Tax Assessment Tax Assessment Total Assessment is a certain percentage of the fair market value that is determined by local assessors to be the total taxable value of land and additions on the property. | Land | Improvement |
|---|---|---|---|---|
| 2025 | $4,136 | $258,167 | $64,542 | $193,625 |
| 2024 | $4,136 | $253,104 | $63,276 | $189,828 |
| 2023 | $4,142 | $248,141 | $62,035 | $186,106 |
| 2022 | $4,151 | $243,276 | $60,819 | $182,457 |
| 2021 | $4,063 | $238,505 | $59,626 | $178,879 |
| 2020 | $4,086 | $236,060 | $59,015 | $177,045 |
| 2019 | $3,988 | $231,432 | $57,858 | $173,574 |
| 2018 | $3,688 | $226,895 | $56,724 | $170,171 |
| 2017 | $3,628 | $222,446 | $55,612 | $166,834 |
| 2016 | $3,615 | $218,085 | $54,522 | $163,563 |
| 2015 | $3,607 | $214,809 | $53,703 | $161,106 |
| 2014 | $3,386 | $210,601 | $52,651 | $157,950 |
Source: Public Records
Map
Nearby Homes
- 11780 Fairway Dr
- 11718 Pactfield Place
- 11967 Southwind Way
- 33353 Wallace Way
- 92399 Yucaipa Blvd
- 11634 Wiggins Ct
- 33825 Cansler Way
- 33540 Washington Dr
- 11811 Cramer Rd
- 11692 Bluegrass Rd
- 12422 Stardell Ln
- 34015 Pinehurst Dr
- 34107 Lake Breeze Dr
- 12510 8th St
- 12419 13th St
- 34075 Lily Rd Unit 37
- 34083 Lily Rd Unit 33
- 34177 Pinehurst Dr
- 34280 Forest Oaks Dr
- 36551 Avenue E
- 11834 Warwick Hills Ct
- 11820 Warwick Hills Ct
- 11811 Fairway Dr
- 11819 Fairway Dr
- 11801 Fairway Dr
- 11827 Fairway Dr
- 11814 Warwick Hills Ct
- 11791 Fairway Dr
- 11817 Warwick Hills Ct
- 33311 Warwick Hills Rd
- 11837 Warwick Hills Ct
- 33321 Warwick Hills Rd
- 33303 Warwick Hills Rd
- 33329 Warwick Hills Rd
- 33335 Manning St
- 33295 Warwick Hills Rd
- 33327 Manning St
- 33343 Manning St
- 11818 Fairway Dr
- 33337 Warwick Hills Rd