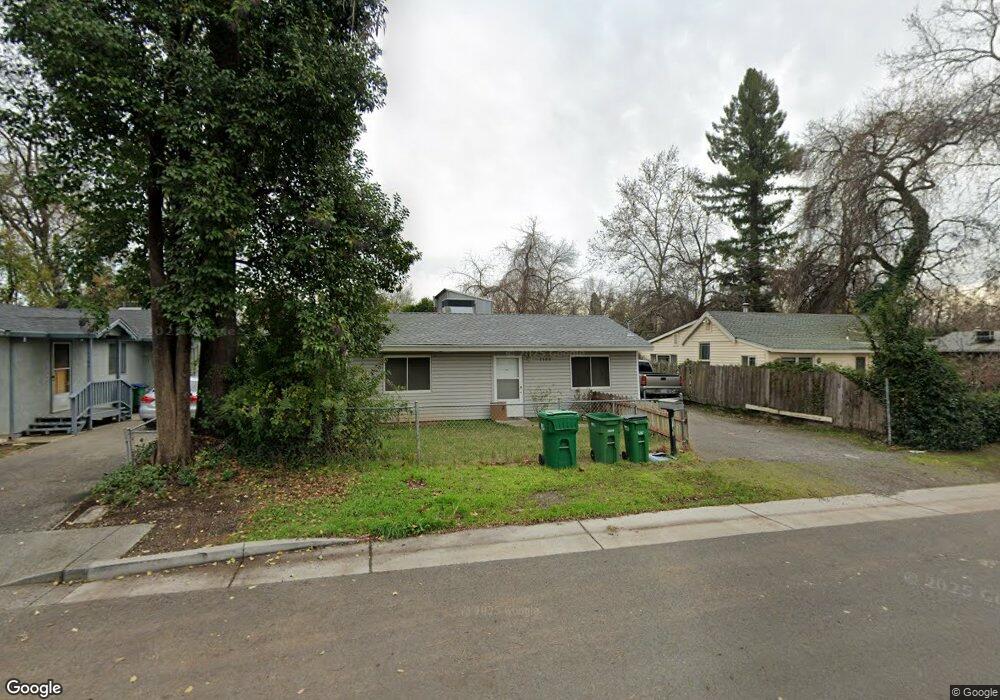
1183 E 10th St Unit 9 Chico, CA 95928
Chapman NeighborhoodEstimated Value: $215,000 - $273,000
2
Beds
1
Bath
656
Sq Ft
$378/Sq Ft
Est. Value
About This Home
This home is located at 1183 E 10th St Unit 9, Chico, CA 95928 and is currently estimated at $248,057, approximately $378 per square foot. 1183 E 10th St Unit 9 is a home located in Butte County with nearby schools including Parkview Elementary School, Chico Junior High School, and Chico High School.
Ownership History
Date
Name
Owned For
Owner Type
Purchase Details
Closed on
Jun 18, 2021
Sold by
Hooper Mark T
Bought by
Santos Hooper Living Trust and Santos
Current Estimated Value
Purchase Details
Closed on
Oct 26, 2010
Sold by
Willadsen Phillip T and Willadsen Wanda J
Bought by
Hooper Mark T
Purchase Details
Closed on
Oct 18, 2002
Sold by
Willadsen Phil T
Bought by
Willadsen Phillip T and Willadsen Wanda J
Home Financials for this Owner
Home Financials are based on the most recent Mortgage that was taken out on this home.
Original Mortgage
$103,000
Interest Rate
7.55%
Purchase Details
Closed on
Oct 1, 1998
Sold by
Allen Charles and Allen Rita J
Bought by
Willadsen Phil T
Home Financials for this Owner
Home Financials are based on the most recent Mortgage that was taken out on this home.
Original Mortgage
$64,020
Interest Rate
6.88%
Create a Home Valuation Report for This Property
The Home Valuation Report is an in-depth analysis detailing your home's value as well as a comparison with similar homes in the area
Home Values in the Area
Average Home Value in this Area
Purchase History
| Date | Buyer | Sale Price | Title Company |
|---|---|---|---|
| Santos Hooper Living Trust | -- | None Listed On Document | |
| Hooper Mark T | $86,730 | None Available | |
| Willadsen Phillip T | -- | Mid Valley Title & Escrow Co | |
| Willadsen Phil T | $66,000 | Mid Valley Title |
Source: Public Records
Mortgage History
| Date | Status | Borrower | Loan Amount |
|---|---|---|---|
| Previous Owner | Willadsen Phillip T | $103,000 | |
| Previous Owner | Willadsen Phil T | $64,020 |
Source: Public Records
Tax History
| Year | Tax Paid | Tax Assessment Tax Assessment Total Assessment is a certain percentage of the fair market value that is determined by local assessors to be the total taxable value of land and additions on the property. | Land | Improvement |
|---|---|---|---|---|
| 2025 | $1,837 | $166,539 | $102,487 | $64,052 |
| 2024 | $1,837 | $163,275 | $100,478 | $62,797 |
| 2023 | $1,816 | $160,074 | $98,508 | $61,566 |
| 2022 | $1,789 | $156,936 | $96,577 | $60,359 |
| 2021 | $1,752 | $153,860 | $94,684 | $59,176 |
| 2020 | $1,750 | $152,284 | $93,714 | $58,570 |
| 2019 | $1,721 | $149,299 | $91,877 | $57,422 |
| 2018 | $1,688 | $146,373 | $90,076 | $56,297 |
| 2017 | $1,651 | $143,504 | $88,310 | $55,194 |
| 2016 | $1,510 | $140,691 | $86,579 | $54,112 |
| 2015 | $1,508 | $138,579 | $85,279 | $53,300 |
| 2014 | $1,477 | $135,865 | $83,609 | $52,256 |
Source: Public Records
Map
Nearby Homes
- 1169 E 9th St
- 1022 Linden St
- 1368 E 9th St
- 1385 E 10th St
- 1322 Guill St
- 667 E 8th St
- 686 E 7th St
- 951 Cleveland Ave
- 555 Vallombrosa Ave Unit 14
- 555 Vallombrosa Ave Unit 25
- 0 California 32
- 1764 Elm St
- 573 E 19th St
- 1871 Auburn Oak Way
- 1224 Locust St
- 271 E 8th St
- 480 E 20th St
- 827 Arbutus Ave
- 1640 Hemlock St
- 1058 Stevie Joe Way
- 1183 E 10th St
- 1185 E 10th St
- 1171 E 10th St
- 1165 E 10th St
- 1170 E 10th St
- 1184 E 10th St
- 1161 E 10th St
- 1166 E 10th St
- 1186 E 10th St
- 1164 E 10th St
- 1198 E 10th St
- 1191 E 9th St
- 1133 Buckwheat Way
- 1001 Willow St
- 1001 Willow St Unit A
- 1001 Willow St Unit C
- 1187 E 9th St
- 1252 E 10th St
- 1167 E 9th St
- 1179 E 9th St
Your Personal Tour Guide
Ask me questions while you tour the home.