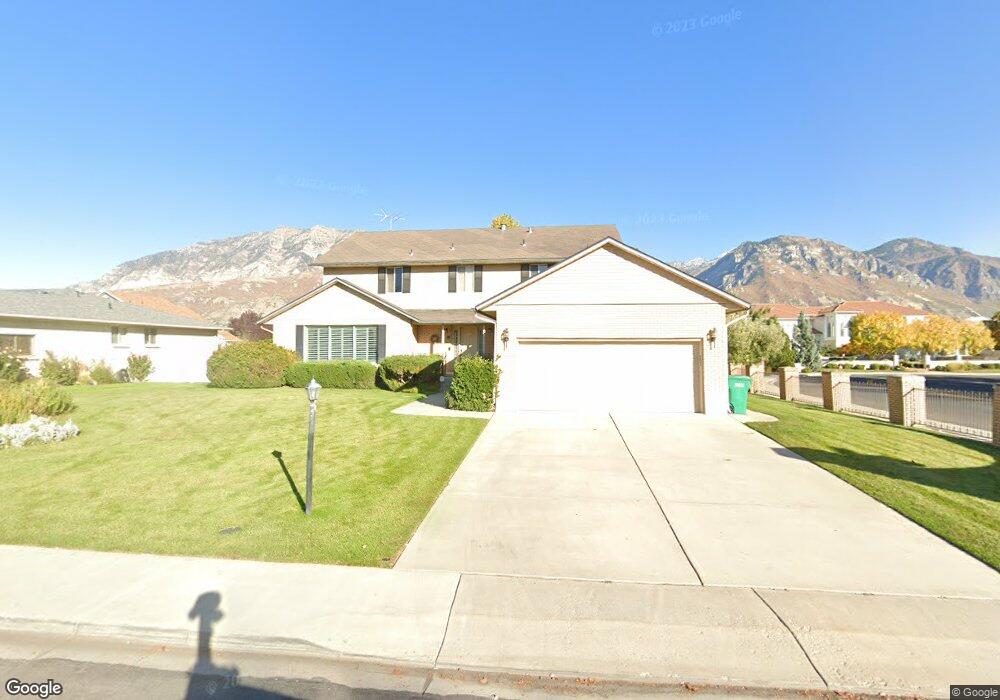
1183 S Palisades Dr Orem, UT 84097
Hillcrest NeighborhoodEstimated Value: $709,000 - $1,235,000
4
Beds
5
Baths
2,812
Sq Ft
$316/Sq Ft
Est. Value
About This Home
This home is located at 1183 S Palisades Dr, Orem, UT 84097 and is currently estimated at $889,052, approximately $316 per square foot. 1183 S Palisades Dr is a home located in Utah County with nearby schools including Centennial Elementary, Lakeridge Jr High School, and Orem High School.
Ownership History
Date
Name
Owned For
Owner Type
Purchase Details
Closed on
Sep 20, 2023
Sold by
Blackley Darline and Phelps Parker Demoyne
Bought by
Blackley Darline and Phelps Neil Robertson
Current Estimated Value
Purchase Details
Closed on
Dec 15, 2020
Sold by
Balckley Darline and Estate Of Demoyne Delroy Black
Bought by
Blackley Darline and Phelps Leesa Jan
Purchase Details
Closed on
Oct 24, 2002
Sold by
Blackley Demoyne D and Blackley Darline
Bought by
Blackley Demoyne and Blackley Darline
Home Financials for this Owner
Home Financials are based on the most recent Mortgage that was taken out on this home.
Original Mortgage
$124,000
Interest Rate
5.99%
Create a Home Valuation Report for This Property
The Home Valuation Report is an in-depth analysis detailing your home's value as well as a comparison with similar homes in the area
Home Values in the Area
Average Home Value in this Area
Purchase History
| Date | Buyer | Sale Price | Title Company |
|---|---|---|---|
| Blackley Darline | -- | None Listed On Document | |
| Blackley Darline | -- | None Available | |
| Blackley Darline | -- | None Available | |
| Blackley Demoyne | -- | Backman Stewart Title Servi |
Source: Public Records
Mortgage History
| Date | Status | Borrower | Loan Amount |
|---|---|---|---|
| Previous Owner | Blackley Demoyne | $124,000 |
Source: Public Records
Tax History
| Year | Tax Paid | Tax Assessment Tax Assessment Total Assessment is a certain percentage of the fair market value that is determined by local assessors to be the total taxable value of land and additions on the property. | Land | Improvement |
|---|---|---|---|---|
| 2025 | $2,943 | $369,985 | -- | -- |
| 2024 | $2,943 | $359,810 | $0 | $0 |
| 2023 | $2,857 | $375,430 | $0 | $0 |
| 2022 | $2,772 | $352,990 | $0 | $0 |
| 2021 | $2,409 | $464,600 | $165,800 | $298,800 |
| 2020 | $2,210 | $422,700 | $132,600 | $290,100 |
| 2019 | $1,977 | $389,600 | $132,600 | $257,000 |
| 2018 | $2,007 | $377,900 | $132,600 | $245,300 |
| 2017 | $2,021 | $203,885 | $0 | $0 |
| 2016 | $1,938 | $180,235 | $0 | $0 |
| 2015 | $2,049 | $180,235 | $0 | $0 |
| 2014 | $1,770 | $154,990 | $0 | $0 |
Source: Public Records
Map
Nearby Homes
- 1169 S Palisades Dr
- 1176 Lynnwood Dr
- 1155 S Palisades Dr
- 1184 Lynnwood Dr
- 1184 S Palisades Dr
- 1160 Lynnwood Dr
- 1170 S Palisades Dr
- 1156 S Palisades Dr
- 1215 S 1000 E
- 1139 S Palisades Dr
- 1144 Lynnwood Dr
- 1140 S Palisades Dr
- 1175 Lynnwood Dr
- 948 E 1120 S
- 1128 Lynnwood Dr
- 1126 S Palisades Dr
- 1137 Lynnwood Dr
- 1120 S Palisades Dr
- 1125 Lynnwood Dr
- 1103 S Carterville Rd
Your Personal Tour Guide
Ask me questions while you tour the home.