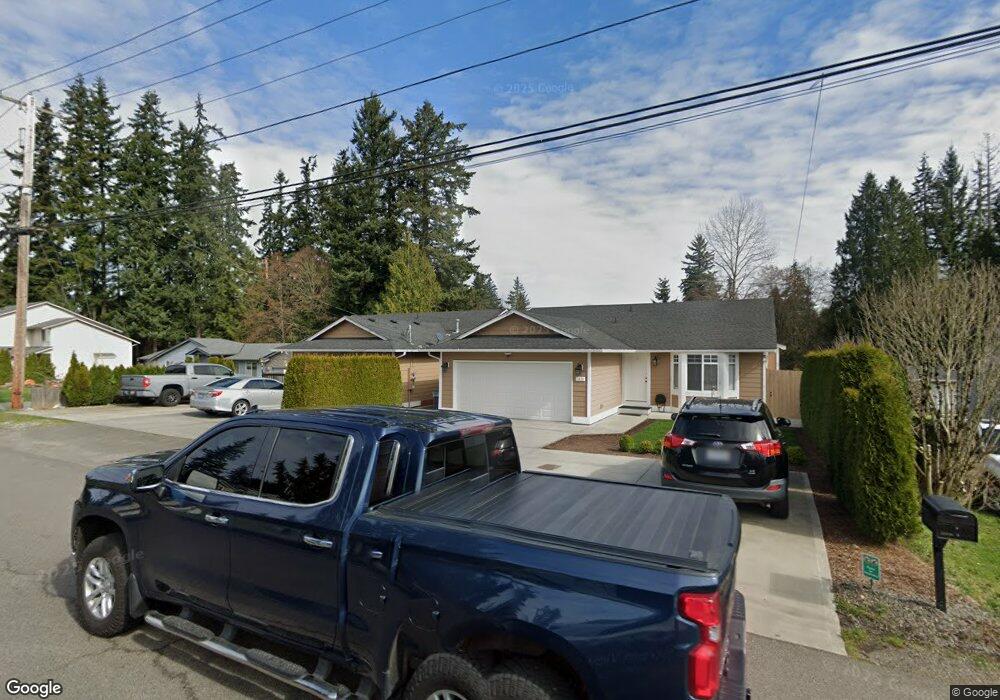
11831 2nd Dr SE Unit A Everett, WA 98208
Paine Field-Lake Stickney NeighborhoodEstimated Value: $482,000 - $550,000
3
Beds
2
Baths
1,146
Sq Ft
$453/Sq Ft
Est. Value
About This Home
This home is located at 11831 2nd Dr SE Unit A, Everett, WA 98208 and is currently estimated at $518,927, approximately $452 per square foot. 11831 2nd Dr SE Unit A is a home located in Snohomish County with nearby schools including Discovery Elementary School, Voyager Middle School, and Mariner High School.
Ownership History
Date
Name
Owned For
Owner Type
Purchase Details
Closed on
Mar 26, 2021
Sold by
Gudakova Yelena
Bought by
Gudakova Yelena and Poksans Natalya
Current Estimated Value
Purchase Details
Closed on
Jun 23, 2005
Sold by
Almejo Veronica Salazar
Bought by
Salazar Arturo
Home Financials for this Owner
Home Financials are based on the most recent Mortgage that was taken out on this home.
Original Mortgage
$35,542
Interest Rate
5.72%
Mortgage Type
Fannie Mae Freddie Mac
Purchase Details
Closed on
Jul 12, 2001
Sold by
Indigo Homes Llc
Bought by
Welch Daylene R
Home Financials for this Owner
Home Financials are based on the most recent Mortgage that was taken out on this home.
Original Mortgage
$142,000
Interest Rate
7.15%
Purchase Details
Closed on
May 16, 2000
Sold by
Peters Catherine D and Murphy David R
Bought by
Indigo Homes Llc
Home Financials for this Owner
Home Financials are based on the most recent Mortgage that was taken out on this home.
Original Mortgage
$110,000
Interest Rate
8.18%
Create a Home Valuation Report for This Property
The Home Valuation Report is an in-depth analysis detailing your home's value as well as a comparison with similar homes in the area
Home Values in the Area
Average Home Value in this Area
Purchase History
| Date | Buyer | Sale Price | Title Company |
|---|---|---|---|
| Gudakova Yelena | -- | None Listed On Document | |
| Salazar Arturo | $11,235 | Chicago | |
| Salazar Arturo | $236,950 | Chicago Title | |
| Welch Daylene R | $177,500 | -- | |
| Indigo Homes Llc | $115,000 | -- |
Source: Public Records
Mortgage History
| Date | Status | Borrower | Loan Amount |
|---|---|---|---|
| Previous Owner | Salazar Arturo | $35,542 | |
| Previous Owner | Salazar Arturo | $201,407 | |
| Previous Owner | Welch Daylene R | $142,000 | |
| Previous Owner | Indigo Homes Llc | $110,000 | |
| Closed | Indigo Homes Llc | $20,000 |
Source: Public Records
Tax History Compared to Growth
Tax History
| Year | Tax Paid | Tax Assessment Tax Assessment Total Assessment is a certain percentage of the fair market value that is determined by local assessors to be the total taxable value of land and additions on the property. | Land | Improvement |
|---|---|---|---|---|
| 2025 | $4,294 | $529,900 | $321,000 | $208,900 |
| 2024 | $4,294 | $503,500 | $301,000 | $202,500 |
| 2023 | $4,370 | $536,100 | $306,000 | $230,100 |
| 2022 | $3,856 | $399,100 | $204,000 | $195,100 |
| 2020 | $3,341 | $336,900 | $169,000 | $167,900 |
| 2019 | $3,087 | $312,000 | $147,000 | $165,000 |
| 2018 | $3,153 | $278,200 | $131,000 | $147,200 |
| 2017 | $2,688 | $241,700 | $103,000 | $138,700 |
| 2016 | $2,408 | $214,300 | $81,000 | $133,300 |
| 2015 | $2,324 | $189,100 | $68,000 | $121,100 |
| 2013 | $2,016 | $152,900 | $52,000 | $100,900 |
Source: Public Records
Map
Nearby Homes
- 308 120th St SE
- 620 112th St SE Unit 154
- 620 112th St SE Unit 193
- 620 112th St SE Unit 227
- 620 112th St SE Unit 323
- 620 112th St SE Unit 205
- 620 112th St SE Unit 23
- 620 112th St SE Unit 174
- 11201 3rd Ave SE Unit 39G
- 404 125th St SE Unit 55
- 212 126th St SE Unit A
- 11622 Silver Lake Rd Unit 71
- 11622 Silver Lake Rd Unit 58
- 11622 Silver Lake Rd Unit 54
- 11918 4th Ave W
- 12403 4th Ave W Unit 1102
- 12423 4th Ave W Unit 6303
- 12505 4th Ave W Unit 1040
- 12505 4th Ave W Unit 2040
- 217 112th St SW Unit D103
- 11831 2nd Dr SE
- 11831 2nd Dr SE Unit B
- 11823 2nd Dr SE
- 4 XX 119th St SE
- 0 XXX 119th St SE
- 11905 2nd Dr SE
- 11905 2nd Dr SE
- 11815 2nd Dr SE
- 312 119th St SE
- 215 119th St SE
- 11904 2nd Dr SE Unit A,B,C
- 11904 2nd Dr SE
- 315 119th St SE
- 11919 2nd Dr SE Unit A & B
- 11919 2nd Dr SE
- 11811 2nd Dr SE
- 11818 2nd Dr SE
- 11818 2nd Dr SE Unit A
- 11916 2nd Dr SE
- 208 119th St SE Unit B