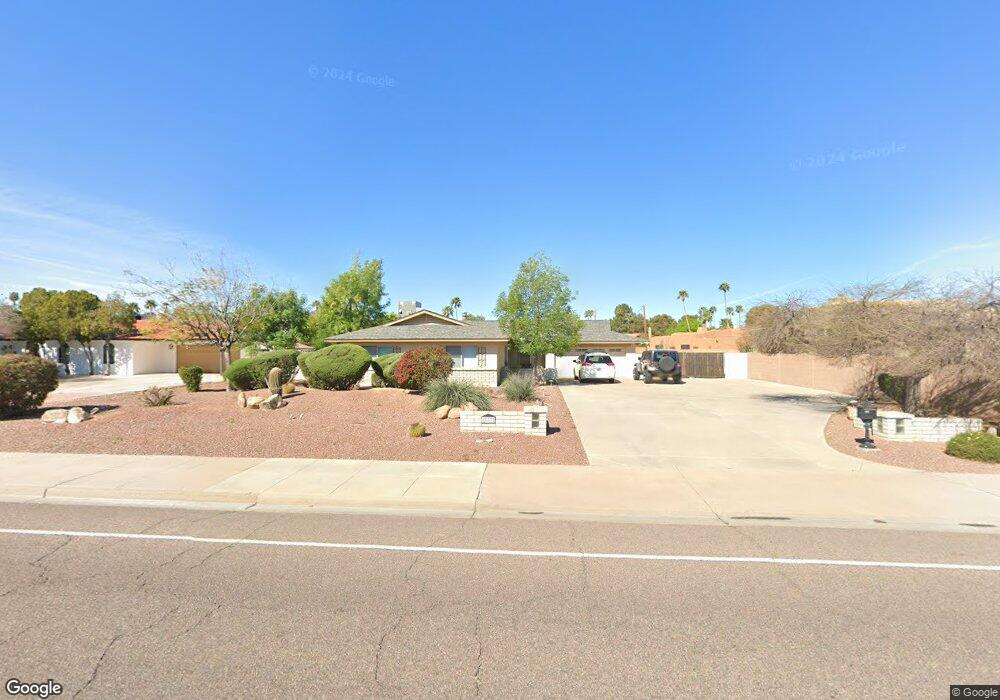
11832 N 28th St Phoenix, AZ 85028
Paradise Valley Village NeighborhoodEstimated Value: $613,407 - $722,000
--
Bed
2
Baths
1,847
Sq Ft
$367/Sq Ft
Est. Value
About This Home
This home is located at 11832 N 28th St, Phoenix, AZ 85028 and is currently estimated at $678,102, approximately $367 per square foot. 11832 N 28th St is a home located in Maricopa County with nearby schools including Desert Cove Elementary School, Shea Middle School, and Shadow Mountain High School.
Ownership History
Date
Name
Owned For
Owner Type
Purchase Details
Closed on
Jan 23, 2019
Sold by
Floyd Ronald L and Floyd Suzy
Bought by
Floyd Ronald L and Floyd Suzy
Current Estimated Value
Home Financials for this Owner
Home Financials are based on the most recent Mortgage that was taken out on this home.
Original Mortgage
$570,000
Outstanding Balance
$512,503
Interest Rate
5.79%
Mortgage Type
FHA
Estimated Equity
$165,599
Purchase Details
Closed on
Jan 15, 2019
Sold by
Floyd Ronald L and Floyd Suzy
Bought by
Floyd Ronald L and Floyd Suzy
Home Financials for this Owner
Home Financials are based on the most recent Mortgage that was taken out on this home.
Original Mortgage
$570,000
Outstanding Balance
$512,503
Interest Rate
5.79%
Mortgage Type
FHA
Estimated Equity
$165,599
Purchase Details
Closed on
Jun 20, 2005
Sold by
Hamilton Financial Foundation
Bought by
Winsett Bette Elizabeth Jane and Bennett Holly Jane
Create a Home Valuation Report for This Property
The Home Valuation Report is an in-depth analysis detailing your home's value as well as a comparison with similar homes in the area
Home Values in the Area
Average Home Value in this Area
Purchase History
| Date | Buyer | Sale Price | Title Company |
|---|---|---|---|
| Floyd Ronald L | -- | Empire West Title Agency Llc | |
| Floyd Ronald L | -- | None Available | |
| Winsett Bette Elizabeth Jane | -- | -- |
Source: Public Records
Mortgage History
| Date | Status | Borrower | Loan Amount |
|---|---|---|---|
| Open | Floyd Ronald L | $570,000 |
Source: Public Records
Tax History Compared to Growth
Tax History
| Year | Tax Paid | Tax Assessment Tax Assessment Total Assessment is a certain percentage of the fair market value that is determined by local assessors to be the total taxable value of land and additions on the property. | Land | Improvement |
|---|---|---|---|---|
| 2025 | $3,014 | $34,805 | -- | -- |
| 2024 | $2,870 | $33,148 | -- | -- |
| 2023 | $2,870 | $45,980 | $9,190 | $36,790 |
| 2022 | $2,843 | $36,460 | $7,290 | $29,170 |
| 2021 | $2,890 | $34,150 | $6,830 | $27,320 |
| 2020 | $2,791 | $32,250 | $6,450 | $25,800 |
| 2019 | $2,803 | $30,380 | $6,070 | $24,310 |
| 2018 | $2,701 | $27,580 | $5,510 | $22,070 |
| 2017 | $2,580 | $27,250 | $5,450 | $21,800 |
| 2016 | $2,539 | $26,000 | $5,200 | $20,800 |
| 2015 | $2,356 | $25,330 | $5,060 | $20,270 |
Source: Public Records
Map
Nearby Homes
- 2715 E Sierra St
- 11806 N 30th St Unit 2
- 2914 E Cactus Rd
- 2838 E Sylvia St
- 3039 E Cactus Rd
- 11449 N Bancroft Dr
- 11816 N Bancroft Dr
- 2607 E Corrine Dr
- 3052 E Lupine Ave
- 11442 N Bancroft Dr
- 2501 E Cholla St
- 3010 E Yucca St
- 2440 E Yucca St
- 2427 E Marmora St
- 2346 E Sylvia St
- 2324 E Cortez St
- 2340 E Sylvia St
- 11007 N 26th St
- 11222 N 32nd St
- 11001 N 26th St
- 2741 E Laurel Ln
- 11820 N 28th St
- 2801 E Laurel Ln
- 11812 N 28th St
- 2740 E Laurel Ln
- 2802 E Laurel Ln
- 2802 E Sunnyside Dr
- 2732 E Laurel Ln
- 2807 E Laurel Ln
- 2717 E Laurel Ln
- 2808 E Sunnyside Dr
- 2808 E Laurel Ln
- 12002 N 28th St
- 2716 E Sunnyside Dr
- 11802 N 28th St
- 2801 E Paradise Dr
- 2716 E Laurel Ln
- 2815 E Laurel Ln
- 2731 E Paradise Dr
- 2725 E Paradise Dr