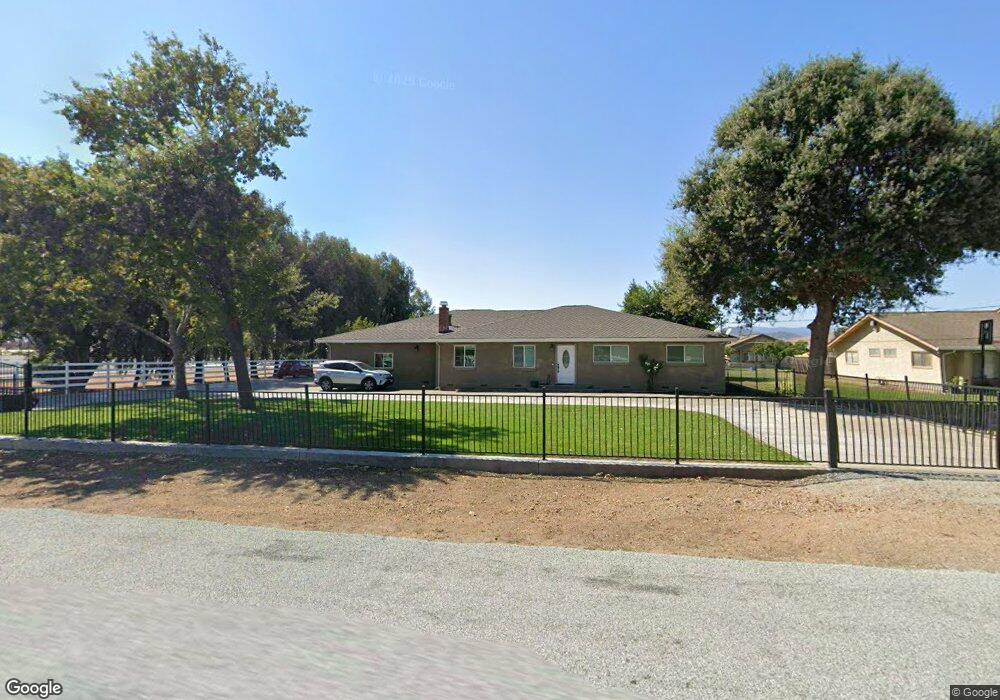
11835 Columbet Ave Gilroy, CA 95020
Estimated Value: $1,215,487 - $1,892,000
3
Beds
3
Baths
1,380
Sq Ft
$1,125/Sq Ft
Est. Value
About This Home
This home is located at 11835 Columbet Ave, Gilroy, CA 95020 and is currently estimated at $1,552,872, approximately $1,125 per square foot. 11835 Columbet Ave is a home located in Santa Clara County with nearby schools including Rucker Elementary School, Solorsano Middle School, and Christopher High School.
Ownership History
Date
Name
Owned For
Owner Type
Purchase Details
Closed on
Sep 4, 2025
Sold by
Thompson Scott William
Bought by
Scott Thompson Family Revocable Living Trust
Current Estimated Value
Purchase Details
Closed on
Feb 21, 2019
Sold by
Romero Cathy Ann
Bought by
Thompson Scott W
Home Financials for this Owner
Home Financials are based on the most recent Mortgage that was taken out on this home.
Original Mortgage
$300,000
Interest Rate
4.4%
Mortgage Type
Credit Line Revolving
Purchase Details
Closed on
Apr 14, 2017
Sold by
Thompson Duane B
Bought by
Thompson Duane B and Thompson Scott W
Purchase Details
Closed on
Jun 10, 2016
Sold by
Thompson Pama Lee
Bought by
Thompson Duane B
Create a Home Valuation Report for This Property
The Home Valuation Report is an in-depth analysis detailing your home's value as well as a comparison with similar homes in the area
Home Values in the Area
Average Home Value in this Area
Purchase History
| Date | Buyer | Sale Price | Title Company |
|---|---|---|---|
| Scott Thompson Family Revocable Living Trust | -- | None Listed On Document | |
| Thompson Family Revocable Living Trust | -- | None Listed On Document | |
| Thompson Scott W | -- | Lawyers Title Co | |
| Thompson Duane B | -- | None Available | |
| Thompson Duane B | -- | None Available |
Source: Public Records
Mortgage History
| Date | Status | Borrower | Loan Amount |
|---|---|---|---|
| Previous Owner | Thompson Scott W | $300,000 |
Source: Public Records
Tax History
| Year | Tax Paid | Tax Assessment Tax Assessment Total Assessment is a certain percentage of the fair market value that is determined by local assessors to be the total taxable value of land and additions on the property. | Land | Improvement |
|---|---|---|---|---|
| 2025 | $4,374 | $353,649 | $29,309 | $324,340 |
| 2024 | $4,374 | $346,716 | $28,735 | $317,981 |
| 2023 | $4,342 | $339,919 | $28,172 | $311,747 |
| 2022 | $4,264 | $333,255 | $27,620 | $305,635 |
| 2021 | $4,243 | $326,722 | $27,079 | $299,643 |
| 2020 | $4,192 | $323,373 | $26,802 | $296,571 |
| 2019 | $2,694 | $201,112 | $26,277 | $174,835 |
| 2018 | $1,125 | $80,842 | $25,762 | $55,080 |
| 2017 | $913 | $60,662 | $25,257 | $35,405 |
| 2016 | $885 | $59,473 | $24,762 | $34,711 |
| 2015 | $839 | $58,581 | $24,391 | $34,190 |
| 2014 | $806 | $57,435 | $23,914 | $33,521 |
Source: Public Records
Map
Nearby Homes
- 310 Lena Ave
- 145 Masten Ave
- 2015 Trumar Ln
- 2055 Rucker Ave
- 12785 Murphy Ave
- 615 Rucker Ave
- 0 New Ave
- 0 Rucker Ave
- 13575 Mammini Ct
- 905 E San Martin Ave
- 13705 Sycamore Ave
- 0 W San Martin Ave
- 0 Buena Vista Ave
- 0A Buena Vista Ave
- 45 Roosevelt Ave
- 730 Lepa Ct
- 12755 Santa Teresa Blvd
- 2143 Buena Vista Ave
- 1450 Lakeview Ct
- 1265 Lions Peak Ln
- 11845 Columbet Ave
- 11830 Columbet Ave
- 11855 Columbet Ave
- 11880 Columbet Ave
- 11790 Columbet Ave
- 11825 Columbet Ave
- 11895 Columbet Ave
- 11900 Columbet Ave
- 11780 Columbet Ave
- 11735 Columbet Ave
- 11930 Columbet Ave
- 11720 Columbet Ave
- 1060 Church Ave
- 11665 Columbet Ave
- 1210 Mary Ct
- 1050 Church Ave
- 11800 Columbet Ave
- 1205 Mary Ct
- 1040 Church Ave
- 1925b Church Ave
Your Personal Tour Guide
Ask me questions while you tour the home.