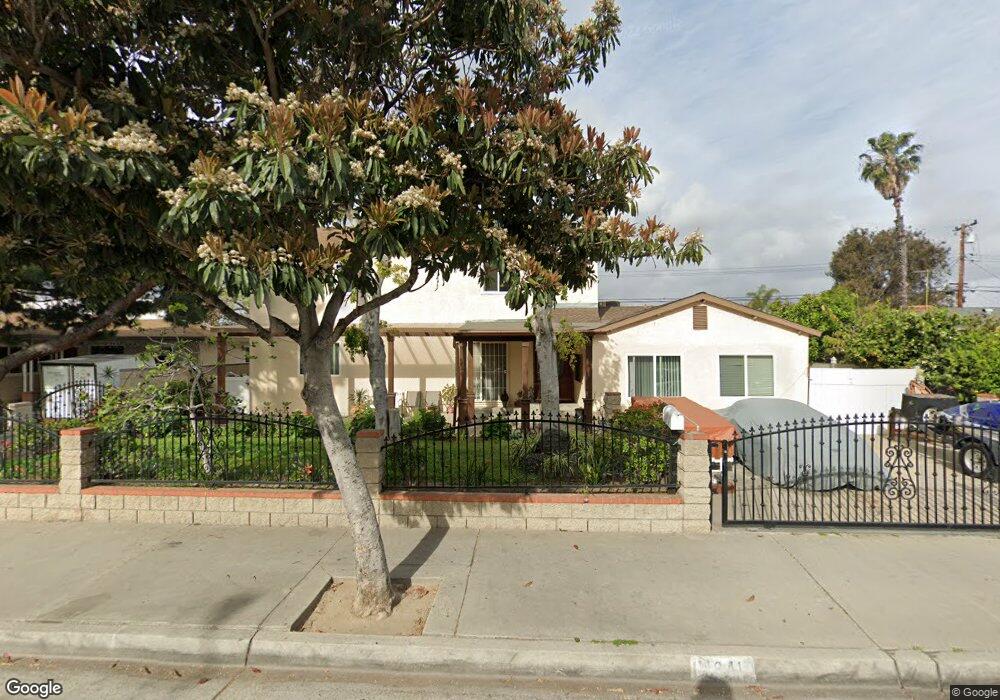
11841 Brookhurst St Garden Grove, CA 92840
Estimated Value: $1,222,000 - $1,894,000
4
Beds
5
Baths
2,945
Sq Ft
$490/Sq Ft
Est. Value
About This Home
This home is located at 11841 Brookhurst St, Garden Grove, CA 92840 and is currently estimated at $1,443,589, approximately $490 per square foot. 11841 Brookhurst St is a home located in Orange County with nearby schools including Gilbert Elementary School, Lake Intermediate School, and Rancho Alamitos High School.
Ownership History
Date
Name
Owned For
Owner Type
Purchase Details
Closed on
Apr 9, 1996
Sold by
Federal Home Loan Mortgage Corporation
Bought by
Filip Pavel and Filip Liliana M
Current Estimated Value
Home Financials for this Owner
Home Financials are based on the most recent Mortgage that was taken out on this home.
Original Mortgage
$112,000
Outstanding Balance
$5,302
Interest Rate
7.41%
Estimated Equity
$1,438,287
Purchase Details
Closed on
Jun 13, 1995
Sold by
First Nationwide Mtg Corp
Bought by
Federal Home Loan Mortgage Corporation
Purchase Details
Closed on
Jun 8, 1995
Sold by
Jeon Chung Ye
Bought by
First Nationwide Mtg Corp
Purchase Details
Closed on
Feb 2, 1995
Sold by
Jeon Cheong Ye
Bought by
Plock Theodore Curtis
Create a Home Valuation Report for This Property
The Home Valuation Report is an in-depth analysis detailing your home's value as well as a comparison with similar homes in the area
Home Values in the Area
Average Home Value in this Area
Purchase History
| Date | Buyer | Sale Price | Title Company |
|---|---|---|---|
| Filip Pavel | $152,000 | First American Title Ins Co | |
| Federal Home Loan Mortgage Corporation | $151,976 | First Southwestern Title Co | |
| First Nationwide Mtg Corp | $151,976 | First Southwestern Title Co | |
| Plock Theodore Curtis | -- | -- |
Source: Public Records
Mortgage History
| Date | Status | Borrower | Loan Amount |
|---|---|---|---|
| Open | Filip Pavel | $112,000 |
Source: Public Records
Tax History Compared to Growth
Tax History
| Year | Tax Paid | Tax Assessment Tax Assessment Total Assessment is a certain percentage of the fair market value that is determined by local assessors to be the total taxable value of land and additions on the property. | Land | Improvement |
|---|---|---|---|---|
| 2025 | $3,491 | $267,456 | $42,031 | $225,425 |
| 2024 | $3,491 | $262,212 | $41,207 | $221,005 |
| 2023 | $3,423 | $257,071 | $40,399 | $216,672 |
| 2022 | $3,370 | $252,031 | $39,607 | $212,424 |
| 2021 | $3,337 | $247,090 | $38,831 | $208,259 |
| 2020 | $3,299 | $244,557 | $38,433 | $206,124 |
| 2019 | $3,223 | $239,762 | $37,679 | $202,083 |
| 2018 | $3,171 | $235,061 | $36,940 | $198,121 |
| 2017 | $3,128 | $230,452 | $36,215 | $194,237 |
| 2016 | $2,980 | $225,934 | $35,505 | $190,429 |
| 2015 | $2,943 | $222,541 | $34,972 | $187,569 |
| 2014 | $2,845 | $218,182 | $34,287 | $183,895 |
Source: Public Records
Map
Nearby Homes
- 10072 Roselee Dr
- 11912 Brookhaven St Unit 65
- 9901 Royal Palm Blvd
- 10221 Roselee Dr
- 10136 Montecito Plaza
- 11421 Barclay Dr
- 12266 Madras Place
- 9751 Oma Place
- 9371 Cellini Ave
- 10087 Hidden Village Rd
- 12262 Morrie Ln
- 12342 Rea Cir
- 11762 Gary St
- 9762 Gamble Ave
- 12071 Marlowe Dr
- 9881 Aldgate Ave
- 11432 Pollard Dr
- 9552 Dewey Dr
- 11971 Medina Dr
- 10112 Becca Dr
- 11851 Brookhurst St
- 11831 Brookhurst St
- 11841 Flamingo Dr
- 11832 Flamingo Dr
- 11801 Brookhurst St
- 11822 Flamingo Dr
- 9932 Cockatoo Ln
- 11791 Brookhurst St
- 10022 Melody Park Dr
- 11802 Flamingo Dr
- 11831 Flamingo Dr
- 9912 Cockatoo Ln
- 11821 Flamingo Dr
- 10032 Melody Park Dr
- 10031 Melody Park Dr
- 11801 Flamingo Dr
- 9902 Cockatoo Ln
- 11771 Brookhurst St
- 9901 Cockatoo Ln
- 10033 Edgewood Ln