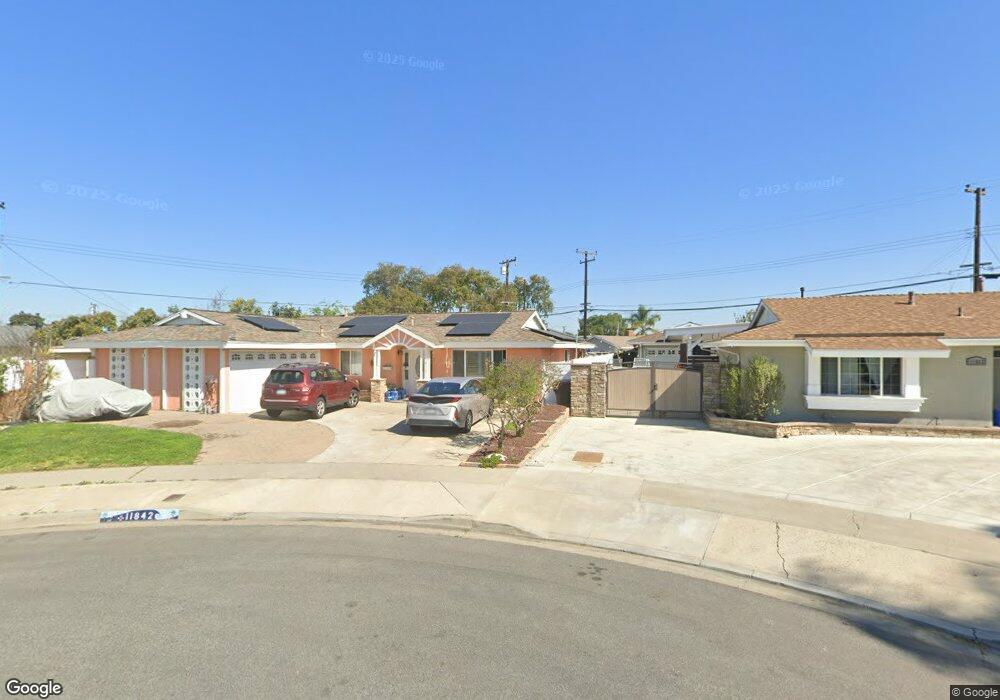
11842 Weaver Cir Garden Grove, CA 92845
West Garden Grove NeighborhoodEstimated Value: $1,036,000 - $1,163,000
3
Beds
2
Baths
1,647
Sq Ft
$679/Sq Ft
Est. Value
About This Home
This home is located at 11842 Weaver Cir, Garden Grove, CA 92845 and is currently estimated at $1,119,068, approximately $679 per square foot. 11842 Weaver Cir is a home located in Orange County with nearby schools including Patton Elementary School, Hilton D. Bell Intermediate School, and Pacifica High School.
Ownership History
Date
Name
Owned For
Owner Type
Purchase Details
Closed on
Sep 23, 2022
Sold by
Yuwana Tanat and Yuwana Apinya
Bought by
Yuwana Family Trust
Current Estimated Value
Purchase Details
Closed on
Mar 18, 2002
Sold by
Yuwana Tanat and Yuwana Apinya
Bought by
Yuwana Tanat and Yuwana Apinya
Home Financials for this Owner
Home Financials are based on the most recent Mortgage that was taken out on this home.
Original Mortgage
$255,000
Interest Rate
6.85%
Purchase Details
Closed on
Jan 29, 1998
Sold by
Persinger Elizabeth S and Persinger Donna S
Bought by
Yuvanavattana Tavatchai and Yuvanavattana Apinya
Home Financials for this Owner
Home Financials are based on the most recent Mortgage that was taken out on this home.
Original Mortgage
$188,100
Interest Rate
7.02%
Purchase Details
Closed on
Jan 30, 1997
Sold by
Cuevas Javier B
Bought by
Cuevas Donna S
Create a Home Valuation Report for This Property
The Home Valuation Report is an in-depth analysis detailing your home's value as well as a comparison with similar homes in the area
Home Values in the Area
Average Home Value in this Area
Purchase History
| Date | Buyer | Sale Price | Title Company |
|---|---|---|---|
| Yuwana Family Trust | -- | -- | |
| Yuwana Tanat | -- | American Title Co | |
| Yuvanavattana Tavatchai | $198,000 | Commonwealth Land Title | |
| Cuevas Donna S | -- | -- |
Source: Public Records
Mortgage History
| Date | Status | Borrower | Loan Amount |
|---|---|---|---|
| Previous Owner | Yuwana Tanat | $255,000 | |
| Previous Owner | Yuvanavattana Tavatchai | $188,100 |
Source: Public Records
Tax History Compared to Growth
Tax History
| Year | Tax Paid | Tax Assessment Tax Assessment Total Assessment is a certain percentage of the fair market value that is determined by local assessors to be the total taxable value of land and additions on the property. | Land | Improvement |
|---|---|---|---|---|
| 2025 | $4,752 | $347,859 | $230,378 | $117,481 |
| 2024 | $4,752 | $341,039 | $225,861 | $115,178 |
| 2023 | $4,653 | $334,352 | $221,432 | $112,920 |
| 2022 | $4,488 | $327,797 | $217,091 | $110,706 |
| 2021 | $4,439 | $321,370 | $212,834 | $108,536 |
| 2020 | $4,388 | $318,075 | $210,651 | $107,424 |
| 2019 | $4,248 | $311,839 | $206,521 | $105,318 |
| 2018 | $4,174 | $305,725 | $202,472 | $103,253 |
| 2017 | $4,110 | $299,731 | $198,502 | $101,229 |
| 2016 | $3,917 | $293,854 | $194,609 | $99,245 |
| 2015 | $3,863 | $289,441 | $191,686 | $97,755 |
| 2014 | $3,739 | $283,772 | $187,931 | $95,841 |
Source: Public Records
Map
Nearby Homes
- 11781 Lamplighter St
- 6861 Reefton Ave
- 6801 Chapman Ave
- 6631 Chapman Ave
- 6897 Leilani Ln
- 11580 Panay St
- 6906 Molokai Dr
- 11474 Shippigan Way
- 11634 Talaud St
- 11390 Nantucket Ct
- 12202 Wutzke St
- 6837 Amelia Way
- 6212 Santa Rita Ave
- 6414 Anguilla Ave
- 6056 Palau St
- 6925 Brightwood Ln Unit 108
- 6971 Knollcrest Ln Unit 47
- 6949 Danvers Dr
- 6884 Almondine Dr
- 5902 Belgrave Ave
- 11852 Weaver Cir
- 6692 Santa Barbara Ave
- 6702 Santa Barbara Ave
- 11841 Weaver Cir
- 6672 Santa Barbara Ave
- 11841 Lamplighter St
- 11831 Lamplighter St
- 11851 Lamplighter St
- 11851 Weaver Cir
- 11821 Lamplighter St
- 11872 Weaver Cir
- 6662 Santa Barbara Ave
- 11871 Lamplighter St
- 11871 Weaver Cir
- 11852 Canter Cir
- 6652 Santa Barbara Ave
- 11882 Weaver Cir
- 6691 Santa Barbara Ave
- 6701 Santa Barbara Ave
- 11842 Canter Cir