NOT LISTED FOR SALE

11849 Coopers Ct Reston, VA 20191

Estimated Value: $521,913 - $556,000

3 Beds
4 Baths
1,176 Sq Ft
$461/Sq Ft Est. Value

Last Sold February 19, 2019

Last sale price $385,000 $327 Per Sq Ft

Est. 41% increase in value since last sale

Current estimated payment $3,384/month

About This Home

As of February 2019

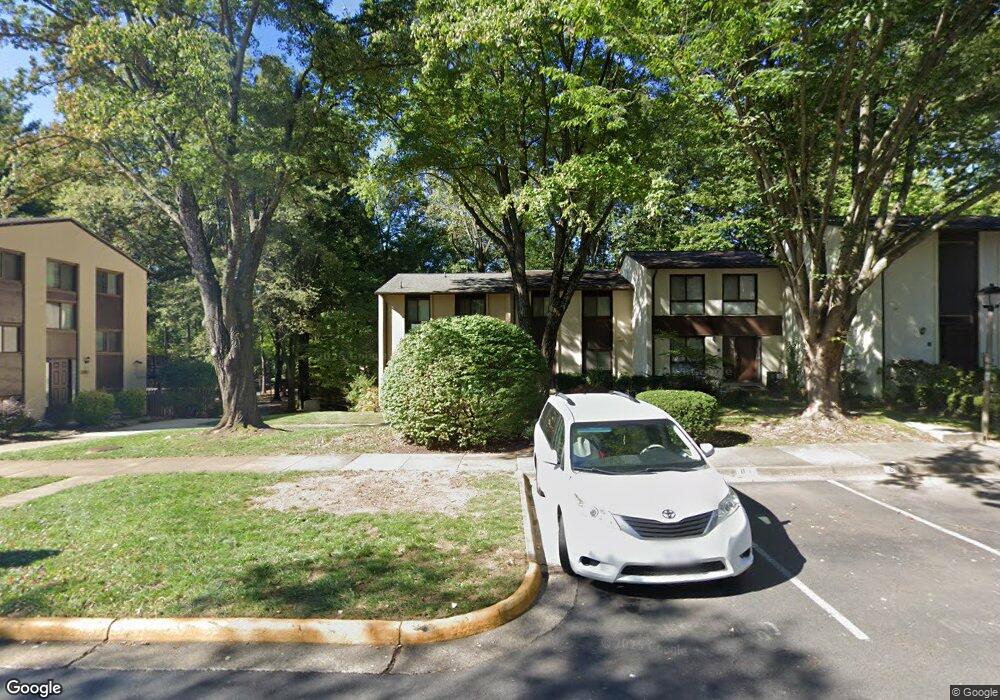
REMODELED CORNER TOWNHOUSE-SOLD Before full marketing plan

Ownership History

Date Name Owned For Owner Type

Purchase Details

Listed on
Feb 18, 2019
Closed on
Feb 19, 2019
Sold by
Rvs Holdings And Investments Co
Bought by
Funk Nathan
Seller's Agent
Renzo Villacorta
EXP Realty, LLC
Buyer's Agent
William Parker
Pearson Smith Realty, LLC
List Price
$384,999
Sold Price
$385,000
Premium/Discount to List
$1
0.0%
Current Estimated Value
$541,978

Home Financials for this Owner

Home Financials are based on the most recent Mortgage that was taken out on this home.
Estimated Appreciation
$156,978
Avg. Annual Appreciation
5.25%
Original Mortgage
$308,000
Outstanding Balance
$270,787
Interest Rate
4.5%
Mortgage Type
New Conventional
Estimated Equity
$271,191

Purchase Details

Closed on
Nov 5, 2018
Sold by
Swan Robert Frnak and Tucke Julia
Bought by
Rvs Holdings And Investments Co

Home Financials for this Owner

Home Financials are based on the most recent Mortgage that was taken out on this home.
Original Mortgage
$275,900
Interest Rate
4.8%
Mortgage Type
Commercial

Purchase Details

Closed on
Nov 15, 1993
Sold by
Swan R F
Bought by
Swan Charles S

Home Financials for this Owner

Home Financials are based on the most recent Mortgage that was taken out on this home.
Original Mortgage
$93,400
Interest Rate
6.79%
Source: Public Records

Range of Values:

Collateral Analytics

Collateral Analytics Collateral Analytics AVMs (Automated Valuation Model) employ a number of statistical approaches combined with neighborhood-specific comparable selection guarantees the most up-to-date and precise valuations.

Not Available

Collateral Analytics does not have data for the current month. Please view the chart for historical values.

ICE

ICE Mortgage Technology ICE Mortgage Technology’s AVM (Automated Valuation Model) is a state-of-the-art online residential property valuation tool that provides a quick and accurate estimate of the value of almost any home in the U.S.

Not Available

ICE Mortgage Technology does not have data for the current month. Please view the chart for historical values.

First American

First American First American Data & Analytics’ next-generation AVM combines unrivaled data assets with a blended ensemble of valuation models to produce highly accurate, reliable valuations you can trust.

Not Available

First American does not have data for the current month. Please view the chart for historical values.

Quantarium

Quantarium Quantarium’s valuation service, repeatedly proven the industry’s most accurate and comprehensive, is supercharged with a self-learning and auto-tuning AI engine that continually becomes smarter and more accurate as it processes daily inputs from the industry’s leading RE data lake.

Not Available

Quantarium does not have data for the current month. Please view the chart for historical values.

Average Value
Not Available
List Price
Sold Price
Create a Home Valuation Report for This Property
The Home Valuation Report is an in-depth analysis detailing your home's value as well as a comparison with similar homes in the area

Home Values in the Area

Source: Public Records

Average Home Value in this Area


Source: Public Records

Purchase History

Date Buyer Sale Price Title Company
Funk Nathan $385,000 Chicago Title Insurance Co
Rvs Holdings And Investments Co $239,000 Chicago Title Insurance Co
Swan Charles S $125,000 --
Source: Public Records

Mortgage History

Date Status Borrower Loan Amount
Open Funk Nathan $308,000
Previous Owner Rvs Holdings And Investments Co $275,900
Previous Owner Swan Charles S $93,400
Source: Public Records

Property History

Date Event Price List to Sale Price per Sq Ft Prior Sale
02/19/2019 02/19/19 Sold $385,000 0.0% $327 / Sq Ft View Prior Sale
02/18/2019 02/18/19 For Sale $384,999 -- $327 / Sq Ft

Tax History Compared to Growth

Source: Public Records

Tax History

Year Tax Paid Tax Assessment Tax Assessment Total Assessment is a certain percentage of the fair market value that is determined by local assessors to be the total taxable value of land and additions on the property. Land Improvement
2025 $5,540 $506,940 $205,000 $301,940
2024 $5,540 $459,600 $185,000 $274,600
2023 $5,072 $431,510 $165,000 $266,510
2022 $4,737 $397,920 $155,000 $242,920
2021 $4,592 $376,200 $140,000 $236,200
2020 $4,413 $358,670 $125,000 $233,670
2019 $4,247 $345,110 $120,000 $225,110
2018 $3,727 $324,060 $102,000 $222,060
2017 $3,915 $324,060 $102,000 $222,060
2016 $3,768 $312,590 $97,000 $215,590
2015 $3,635 $312,590 $97,000 $215,590
2014 $3,577 $308,270 $97,000 $211,270
Source: Public Records

Agents Affiliated with this Home

  • Section Image
  • Section Image
See All Agents

Map