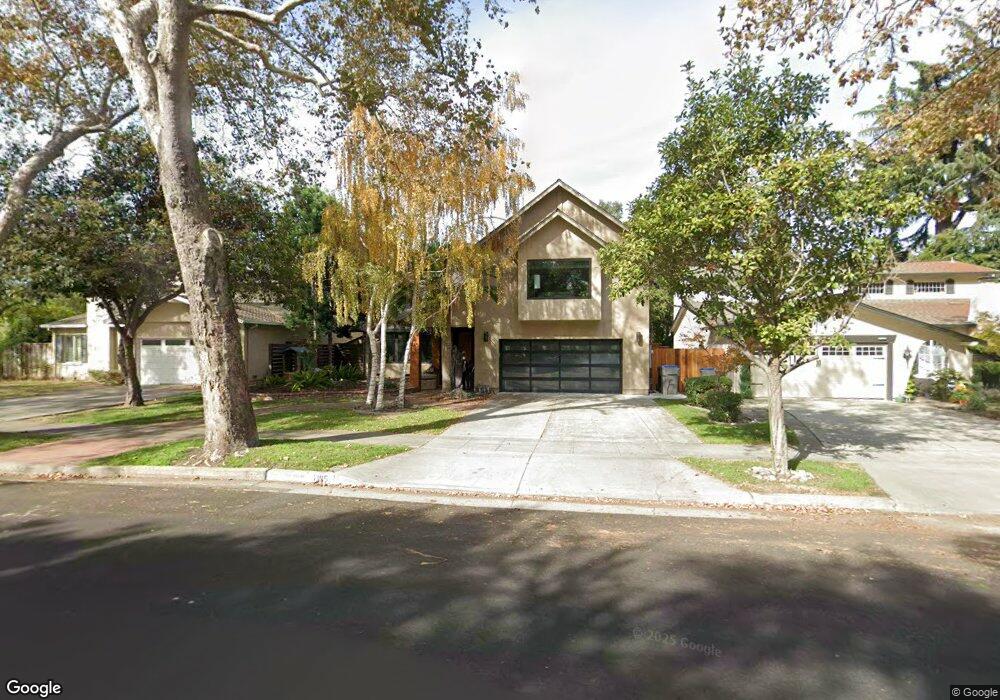
1185 Mckendrie St San Jose, CA 95126
Rose Garden NeighborhoodEstimated Value: $2,140,000 - $2,749,000
5
Beds
3
Baths
2,346
Sq Ft
$1,088/Sq Ft
Est. Value
About This Home
This home is located at 1185 Mckendrie St, San Jose, CA 95126 and is currently estimated at $2,553,575, approximately $1,088 per square foot. 1185 Mckendrie St is a home located in Santa Clara County with nearby schools including Merritt Trace Elementary, Herbert Hoover Middle School, and Abraham Lincoln High.
Ownership History
Date
Name
Owned For
Owner Type
Purchase Details
Closed on
May 25, 2010
Sold by
Rappaport Mary L
Bought by
Reckis Robert P and Reckis Lisa V P
Current Estimated Value
Home Financials for this Owner
Home Financials are based on the most recent Mortgage that was taken out on this home.
Original Mortgage
$50,000
Outstanding Balance
$33,543
Interest Rate
4.99%
Mortgage Type
Stand Alone Second
Estimated Equity
$2,520,032
Purchase Details
Closed on
Aug 19, 1996
Sold by
Rappaport Mary L
Bought by
Rappaport Maurice and Rappaport Mary L
Create a Home Valuation Report for This Property
The Home Valuation Report is an in-depth analysis detailing your home's value as well as a comparison with similar homes in the area
Home Values in the Area
Average Home Value in this Area
Purchase History
| Date | Buyer | Sale Price | Title Company |
|---|---|---|---|
| Reckis Robert P | $902,500 | Old Republic Title Company | |
| Rappaport Maurice | -- | -- |
Source: Public Records
Mortgage History
| Date | Status | Borrower | Loan Amount |
|---|---|---|---|
| Open | Reckis Robert P | $50,000 | |
| Open | Reckis Robert P | $417,000 |
Source: Public Records
Tax History
| Year | Tax Paid | Tax Assessment Tax Assessment Total Assessment is a certain percentage of the fair market value that is determined by local assessors to be the total taxable value of land and additions on the property. | Land | Improvement |
|---|---|---|---|---|
| 2025 | $15,332 | $1,164,822 | $698,844 | $465,978 |
| 2024 | $15,332 | $1,141,984 | $685,142 | $456,842 |
| 2023 | $15,038 | $1,119,593 | $671,708 | $447,885 |
| 2022 | $14,891 | $1,097,641 | $658,538 | $439,103 |
| 2021 | $14,568 | $1,076,120 | $645,626 | $430,494 |
| 2020 | $14,183 | $1,065,086 | $639,006 | $426,080 |
| 2019 | $13,859 | $1,044,203 | $626,477 | $417,726 |
| 2018 | $13,712 | $1,023,730 | $614,194 | $409,536 |
| 2017 | $13,597 | $1,003,657 | $602,151 | $401,506 |
| 2016 | $13,382 | $983,979 | $590,345 | $393,634 |
| 2015 | $12,917 | $969,200 | $581,478 | $387,722 |
| 2014 | $12,445 | $950,216 | $570,088 | $380,128 |
Source: Public Records
Map
Nearby Homes
- 966 Silicon Dr
- 1035 Newhall St
- 931 Vermont St
- 1190 Emory St
- 5 Mckillop Ct
- 1525 Mckendrie St
- 907 Rancho Place
- 860 Asbury St
- 1830 Heatherdale Ave
- 677 Elm St
- 1012 Chestnut St
- 1915 Heatherdale Ave
- 900 Villa Ave
- 1915 Bel Air Ave
- 1304 Singletary Ave
- 1555 Calaveras Ave
- 798 Pershing Ave
- 267 Brooklyn Ave
- 2141 Bel Air Ave
- 808 Lenzen Ave Unit 106
- 1175 Mckendrie St
- 1195 Mckendrie St
- 962 Morse St
- 1155 Mckendrie St
- 970 Morse St
- 1180 Mckendrie St
- 1198 Mckendrie St
- 1205 Mckendrie St
- 1170 Mckendrie St
- 988 Morse St
- 969 Morse St
- 1215 Mckendrie St
- 936 Morse St
- 1156 Mckendrie St
- 945 Morse St
- 992 Morse St
- 980 Morse St
- 1142 Mckendrie St
- 979 Morse St
- 930 Morse St