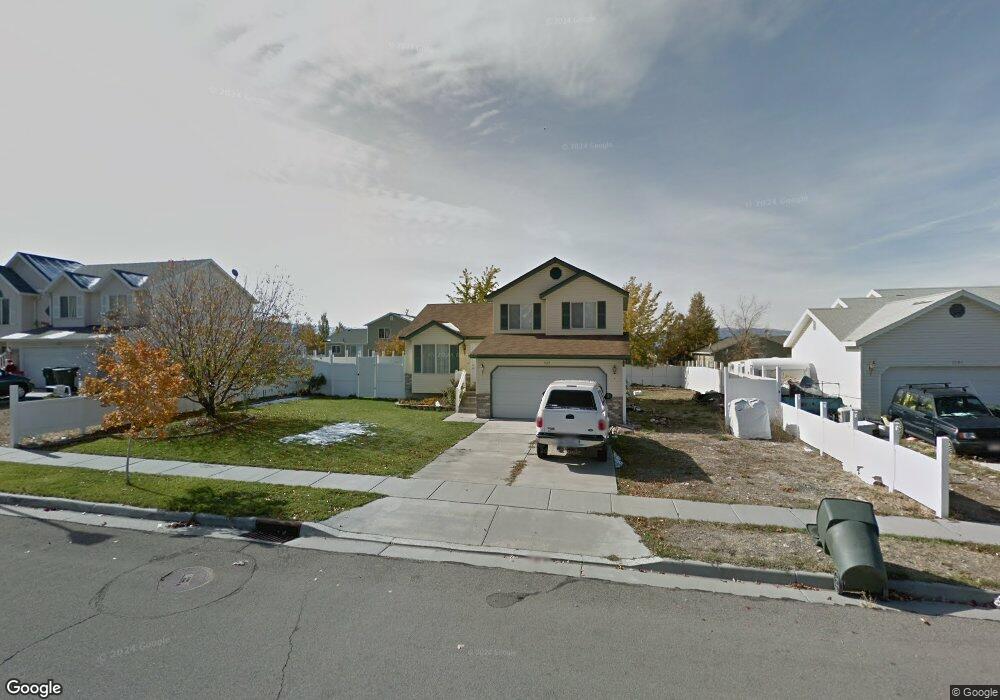
1185 N 490 E Tooele, UT 84074
Estimated Value: $404,051 - $426,000
4
Beds
2
Baths
1,858
Sq Ft
$223/Sq Ft
Est. Value
About This Home
This home is located at 1185 N 490 E, Tooele, UT 84074 and is currently estimated at $413,513, approximately $222 per square foot. 1185 N 490 E is a home located in Tooele County with nearby schools including Copper Canyon Elementary School, Clarke N. Johnsen Junior High School, and Stansbury High School.
Ownership History
Date
Name
Owned For
Owner Type
Purchase Details
Closed on
Jul 5, 2012
Sold by
Thacker Kenneth C and Thacker Melissa D
Bought by
Fonseca Manuel S
Current Estimated Value
Home Financials for this Owner
Home Financials are based on the most recent Mortgage that was taken out on this home.
Original Mortgage
$5,700
Outstanding Balance
$3,948
Interest Rate
3.74%
Mortgage Type
Seller Take Back
Estimated Equity
$409,565
Create a Home Valuation Report for This Property
The Home Valuation Report is an in-depth analysis detailing your home's value as well as a comparison with similar homes in the area
Purchase History
| Date | Buyer | Sale Price | Title Company |
|---|---|---|---|
| Fonseca Manuel S | -- | Inwest Title |
Source: Public Records
Mortgage History
| Date | Status | Borrower | Loan Amount |
|---|---|---|---|
| Open | Fonseca Manuel S | $5,700 |
Source: Public Records
Tax History
| Year | Tax Paid | Tax Assessment Tax Assessment Total Assessment is a certain percentage of the fair market value that is determined by local assessors to be the total taxable value of land and additions on the property. | Land | Improvement |
|---|---|---|---|---|
| 2025 | $2,334 | $353,923 | $103,750 | $250,173 |
| 2024 | $2,478 | $189,179 | $57,063 | $132,116 |
| 2023 | $2,478 | $193,568 | $54,342 | $139,226 |
| 2022 | $2,189 | $188,303 | $54,227 | $134,076 |
| 2021 | $1,735 | $124,826 | $21,691 | $103,135 |
| 2020 | $1,669 | $208,374 | $39,438 | $168,936 |
| 2019 | $1,572 | $193,016 | $39,438 | $153,578 |
| 2018 | $1,461 | $170,151 | $40,000 | $130,151 |
| 2017 | $1,278 | $176,516 | $30,000 | $146,516 |
| 2016 | $1,053 | $86,573 | $16,500 | $70,073 |
| 2015 | $1,053 | $76,608 | $0 | $0 |
| 2014 | -- | $76,608 | $0 | $0 |
Source: Public Records
Map
Nearby Homes
Your Personal Tour Guide
Ask me questions while you tour the home.