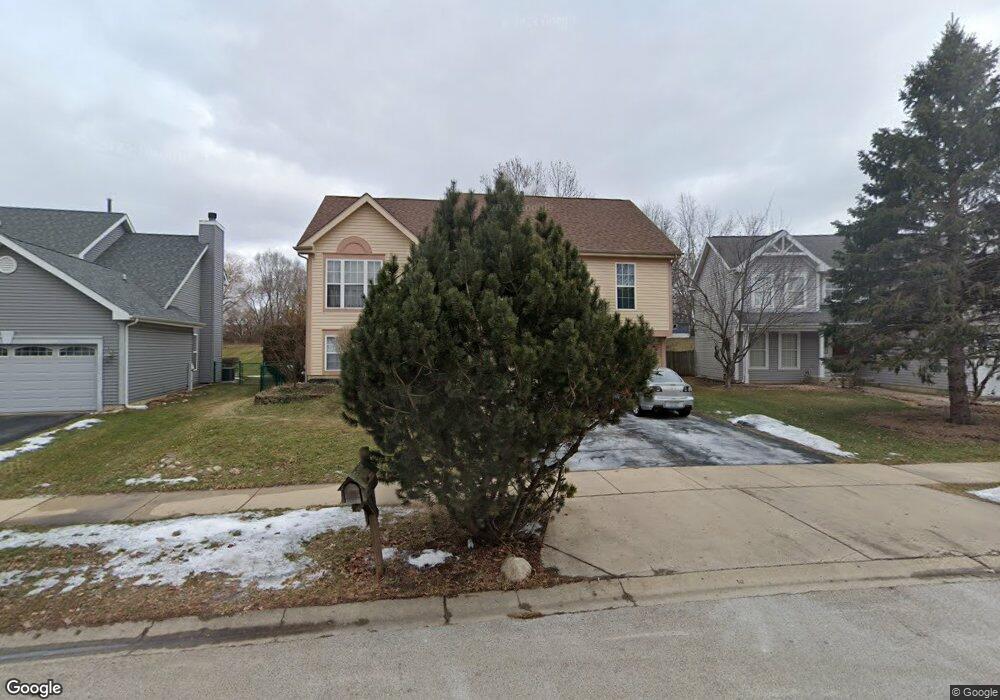
1185 N Elma Ave Elgin, IL 60120
Cobblers Crossing NeighborhoodEstimated Value: $408,000 - $464,000
4
Beds
3
Baths
1,548
Sq Ft
$280/Sq Ft
Est. Value
About This Home
This home is located at 1185 N Elma Ave, Elgin, IL 60120 and is currently estimated at $432,874, approximately $279 per square foot. 1185 N Elma Ave is a home located in Cook County with nearby schools including Lincoln Elementary School, Larsen Middle School, and Elgin High School.
Ownership History
Date
Name
Owned For
Owner Type
Purchase Details
Closed on
Sep 12, 2005
Sold by
Munoz Marciano and Munoz Constantina
Bought by
Munoz Marciano and Munoz Constantina
Current Estimated Value
Purchase Details
Closed on
Mar 25, 2005
Sold by
Eyrich Robert M and Eyrich Debra L
Bought by
Munoz Marciano
Home Financials for this Owner
Home Financials are based on the most recent Mortgage that was taken out on this home.
Original Mortgage
$197,750
Outstanding Balance
$100,917
Interest Rate
5.71%
Mortgage Type
Unknown
Estimated Equity
$331,957
Purchase Details
Closed on
Dec 17, 1993
Sold by
Cobblers Crossing Premier Ltd Prtnrshp
Bought by
Eyrich Robert M and Eyrich Debra L
Home Financials for this Owner
Home Financials are based on the most recent Mortgage that was taken out on this home.
Original Mortgage
$153,624
Interest Rate
7.29%
Mortgage Type
FHA
Create a Home Valuation Report for This Property
The Home Valuation Report is an in-depth analysis detailing your home's value as well as a comparison with similar homes in the area
Home Values in the Area
Average Home Value in this Area
Purchase History
| Date | Buyer | Sale Price | Title Company |
|---|---|---|---|
| Munoz Marciano | -- | Cti | |
| Munoz Marciano | $282,500 | Atg Search | |
| Eyrich Robert M | $106,666 | Intercounty Title |
Source: Public Records
Mortgage History
| Date | Status | Borrower | Loan Amount |
|---|---|---|---|
| Open | Munoz Marciano | $197,750 | |
| Previous Owner | Eyrich Robert M | $153,624 |
Source: Public Records
Tax History Compared to Growth
Tax History
| Year | Tax Paid | Tax Assessment Tax Assessment Total Assessment is a certain percentage of the fair market value that is determined by local assessors to be the total taxable value of land and additions on the property. | Land | Improvement |
|---|---|---|---|---|
| 2024 | $7,681 | $30,000 | $10,176 | $19,824 |
| 2023 | $7,435 | $30,000 | $10,176 | $19,824 |
| 2022 | $7,435 | $30,000 | $10,176 | $19,824 |
| 2021 | $6,407 | $21,924 | $6,541 | $15,383 |
| 2020 | $6,445 | $21,924 | $6,541 | $15,383 |
| 2019 | $6,415 | $24,360 | $6,541 | $17,819 |
| 2018 | $6,762 | $23,339 | $5,814 | $17,525 |
| 2017 | $6,762 | $23,339 | $5,814 | $17,525 |
| 2016 | $6,642 | $23,339 | $5,814 | $17,525 |
| 2015 | $6,395 | $20,825 | $5,087 | $15,738 |
| 2014 | $6,212 | $20,825 | $5,087 | $15,738 |
| 2013 | $5,988 | $20,825 | $5,087 | $15,738 |
Source: Public Records
Map
Nearby Homes
- 1321 Providence Cir Unit 153
- 1230 Spring Creek Rd Unit 10A
- 1104 Loganbury Ct Unit 33211
- 1212 Shawford Way Unit 17
- 1111 Clover Hill Ln
- 1159 Spring Creek Rd
- 1354 Dakota Dr
- 1227 Asbury Ct Unit 252122
- 1830 Maureen Dr Unit 241
- Vacant Lot Parcel 1 Congdon Ave
- 761 Stewart Ave
- 6068 Halloran Ln Unit 361
- 1181 Hiawatha Dr
- 6077 Delaney Dr Unit 202
- 1823 Kelberg Ave Unit 144
- 1152 Hiawatha Dr
- 1409 Dundee Ave
- 656 Ford Ave
- 6074 Frank Dr
- 2221 Edgartown Ln
- 1189 N Elma Ave
- 1175 N Elma Ave
- 1165 N Elma Ave
- 1195 N Elma Ave
- 1180 N Elma Ave Unit 10B
- 1170 N Elma Ave
- 1190 N Elma Ave
- 1159 N Elma Ave Unit 10B
- 1061 Huron Ct
- 1160 N Elma Ave
- 1063 Huron Ct
- 1200 N Elma Ave
- 1155 N Elma Ave
- 1150 N Elma Ave
- 1065 Huron Ct
- 1159 Deep Woods Dr
- 1210 N Elma Ave
- 1165 Deep Woods Dr
- 1151 Deep Woods Dr
- 1145 N Elma Ave