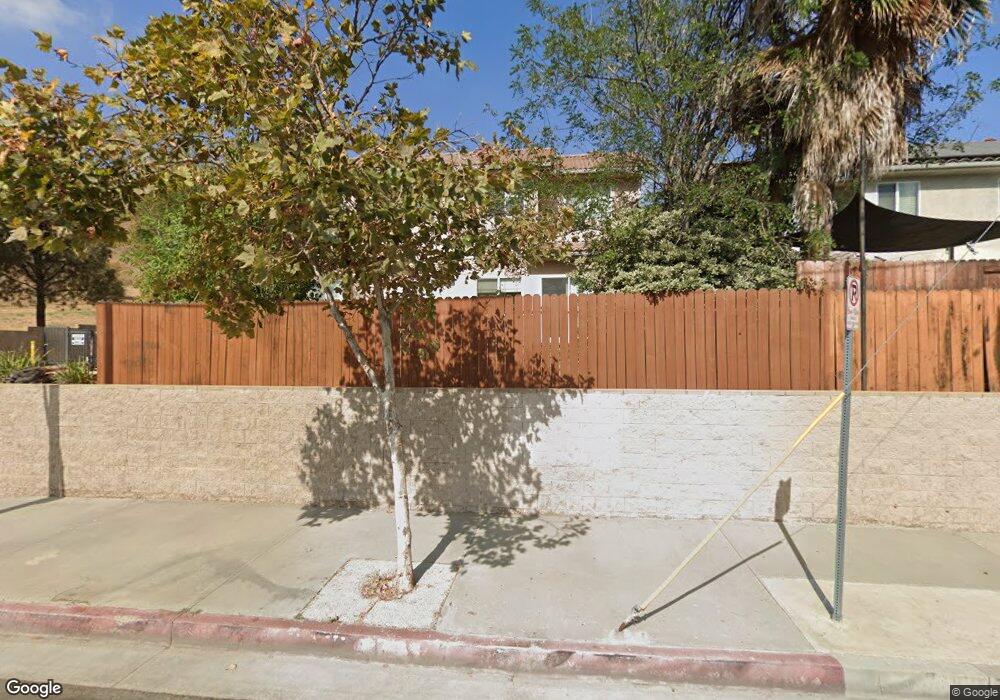
11851 Apple Grove Ln Sylmar, CA 91342
Estimated Value: $877,000 - $1,012,000
4
Beds
3
Baths
2,457
Sq Ft
$392/Sq Ft
Est. Value
About This Home
This home is located at 11851 Apple Grove Ln, Sylmar, CA 91342 and is currently estimated at $962,131, approximately $391 per square foot. 11851 Apple Grove Ln is a home located in Los Angeles County with nearby schools including Charles Maclay Middle School, San Fernando Senior High School, and Fenton Avenue Charter School.
Ownership History
Date
Name
Owned For
Owner Type
Purchase Details
Closed on
Oct 3, 2022
Sold by
Chu Hoon
Bought by
Chu Young Sook
Current Estimated Value
Purchase Details
Closed on
Jul 17, 2015
Sold by
Chu Hoon
Bought by
Chu Hoon and Chu Young Sook
Purchase Details
Closed on
Aug 3, 2009
Sold by
Chu Young Sook
Bought by
Chu Hoon
Purchase Details
Closed on
Aug 23, 2006
Sold by
Chu Hoon and Chu Young Sook
Bought by
Chu Hoon
Purchase Details
Closed on
May 10, 2005
Sold by
Chu Young Sook
Bought by
Chu Hoon
Purchase Details
Closed on
Feb 10, 2005
Sold by
Calabasas 2000 Lp
Bought by
Chu Hoon
Home Financials for this Owner
Home Financials are based on the most recent Mortgage that was taken out on this home.
Original Mortgage
$439,920
Interest Rate
5.5%
Mortgage Type
New Conventional
Create a Home Valuation Report for This Property
The Home Valuation Report is an in-depth analysis detailing your home's value as well as a comparison with similar homes in the area
Home Values in the Area
Average Home Value in this Area
Purchase History
| Date | Buyer | Sale Price | Title Company |
|---|---|---|---|
| Chu Young Sook | -- | Accommodation/Courtesy Recordi | |
| Chu Hoon | -- | Accommodation | |
| Chu Hoon | -- | None Available | |
| Chu Hoon | -- | None Available | |
| Chu Hoon | -- | None Available | |
| Chu Hoon | -- | None Available | |
| Chu Hoon | -- | Investors Title Company | |
| Chu Hoon | $550,000 | Ticor Title Co Of California |
Source: Public Records
Mortgage History
| Date | Status | Borrower | Loan Amount |
|---|---|---|---|
| Previous Owner | Chu Hoon | $439,920 | |
| Closed | Chu Hoon | $54,950 |
Source: Public Records
Tax History Compared to Growth
Tax History
| Year | Tax Paid | Tax Assessment Tax Assessment Total Assessment is a certain percentage of the fair market value that is determined by local assessors to be the total taxable value of land and additions on the property. | Land | Improvement |
|---|---|---|---|---|
| 2025 | $9,439 | $766,495 | $345,543 | $420,952 |
| 2024 | $9,439 | $751,467 | $338,768 | $412,699 |
| 2023 | $9,257 | $736,733 | $332,126 | $404,607 |
| 2022 | $8,825 | $722,288 | $325,614 | $396,674 |
| 2021 | $8,059 | $653,000 | $293,000 | $360,000 |
| 2019 | $7,105 | $573,000 | $257,000 | $316,000 |
| 2018 | $7,153 | $573,000 | $257,000 | $316,000 |
| 2016 | $5,831 | $467,800 | $209,600 | $258,200 |
| 2015 | $5,071 | $404,000 | $181,000 | $223,000 |
| 2014 | $5,189 | $404,000 | $181,000 | $223,000 |
Source: Public Records
Map
Nearby Homes
- 11926 Kathyann St
- 11870 Jouett St
- 11863 Vanport Ave
- 12036 Jouett St
- 11845 Gladstone Ave
- 11529 Hunnewell Ave
- 12331 Carl St
- 0 Terra Vista Way
- 12401 Filmore St Unit 212
- 12401 Filmore St
- 12229 Inspire Ln
- 12339 Carl St
- 12001 Foothill Blvd Unit 56
- 11645 N Delft Ln
- 11377 Gladstone Ave
- 11465 Fox Hollow Ln
- 11715 Garrick Ave
- 12423 Sonoma Dr Unit 8
- 11555 Eldridge Ave
- 11384 Dronfield Terrace Unit 36
- 11851 Birch Grove Ln
- 11847 Apple Grove Ln Unit 102
- 11847 Apple Grove Ln
- 11852 Apple Grove Ln Unit 110
- 11852 Apple Grove Ln
- 11848 Apple Grove Ln Unit 109
- 11848 Apple Grove Ln
- 11843 Apple Grove Ln
- 11844 Apple Grove Ln
- 12050 Van Nuys Blvd
- 11839 Apple Grove Ln Unit 104
- 11840 Apple Grove Ln Unit 107
- 11840 Apple Grove Ln
- 11859 Birch Grove Ln
- 11855 Birch Grove Ln
- 11835 Apple Grove Ln Unit 105
- 11835 Apple Grove Ln
- 11836 Apple Grove Ln Unit 106
- 11836 Apple Grove Ln
- 12058 Van Nuys Blvd