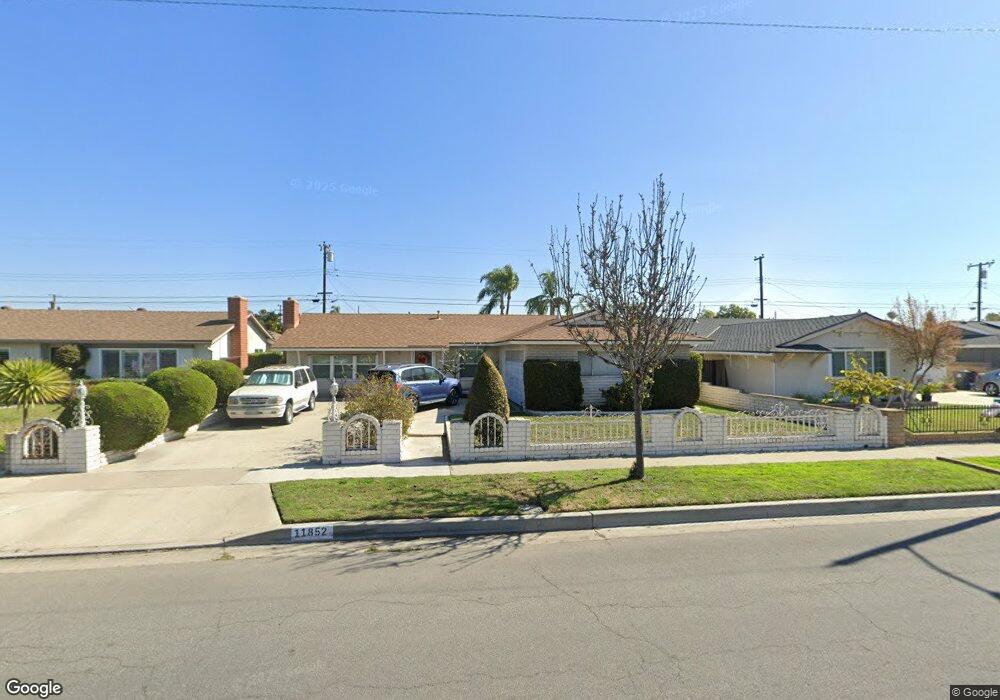
11852 Wutzke St Garden Grove, CA 92845
West Garden Grove NeighborhoodEstimated Value: $1,021,000 - $1,103,000
4
Beds
2
Baths
1,361
Sq Ft
$776/Sq Ft
Est. Value
About This Home
This home is located at 11852 Wutzke St, Garden Grove, CA 92845 and is currently estimated at $1,055,813, approximately $775 per square foot. 11852 Wutzke St is a home located in Orange County with nearby schools including Patton Elementary School, Hilton D. Bell Intermediate School, and Pacifica High School.
Ownership History
Date
Name
Owned For
Owner Type
Purchase Details
Closed on
May 25, 2005
Sold by
Roman Ozzie and Roman Frances
Bought by
Roman Ozzie and Roman Frances
Current Estimated Value
Home Financials for this Owner
Home Financials are based on the most recent Mortgage that was taken out on this home.
Original Mortgage
$160,000
Outstanding Balance
$79,970
Interest Rate
5.2%
Mortgage Type
Negative Amortization
Estimated Equity
$975,843
Purchase Details
Closed on
Mar 11, 2003
Sold by
Roman Frances and Roman Ozzie
Bought by
Roman Ozzie and Roman Frances
Home Financials for this Owner
Home Financials are based on the most recent Mortgage that was taken out on this home.
Original Mortgage
$155,000
Interest Rate
5.82%
Purchase Details
Closed on
Feb 11, 1997
Sold by
Lamkin Gloria J
Bought by
Thompson Frances R and Roman Ozzie
Home Financials for this Owner
Home Financials are based on the most recent Mortgage that was taken out on this home.
Original Mortgage
$161,500
Interest Rate
7.9%
Create a Home Valuation Report for This Property
The Home Valuation Report is an in-depth analysis detailing your home's value as well as a comparison with similar homes in the area
Home Values in the Area
Average Home Value in this Area
Purchase History
| Date | Buyer | Sale Price | Title Company |
|---|---|---|---|
| Roman Ozzie | -- | Civic Center Title Services | |
| Roman Ozzie | -- | Southland Title | |
| Thompson Frances R | $170,000 | -- |
Source: Public Records
Mortgage History
| Date | Status | Borrower | Loan Amount |
|---|---|---|---|
| Open | Roman Ozzie | $160,000 | |
| Closed | Roman Ozzie | $155,000 | |
| Closed | Thompson Frances R | $161,500 |
Source: Public Records
Tax History Compared to Growth
Tax History
| Year | Tax Paid | Tax Assessment Tax Assessment Total Assessment is a certain percentage of the fair market value that is determined by local assessors to be the total taxable value of land and additions on the property. | Land | Improvement |
|---|---|---|---|---|
| 2025 | $3,859 | $276,864 | $190,413 | $86,451 |
| 2024 | $3,859 | $271,436 | $186,680 | $84,756 |
| 2023 | $3,775 | $266,114 | $183,019 | $83,095 |
| 2022 | $3,702 | $260,897 | $179,431 | $81,466 |
| 2021 | $3,661 | $255,782 | $175,913 | $79,869 |
| 2020 | $3,619 | $253,160 | $174,109 | $79,051 |
| 2019 | $3,499 | $248,197 | $170,696 | $77,501 |
| 2018 | $3,437 | $243,331 | $167,349 | $75,982 |
| 2017 | $3,384 | $238,560 | $164,067 | $74,493 |
| 2016 | $3,229 | $233,883 | $160,850 | $73,033 |
| 2015 | $3,183 | $230,370 | $158,434 | $71,936 |
| 2014 | $3,083 | $225,858 | $155,331 | $70,527 |
Source: Public Records
Map
Nearby Homes
- 6631 Chapman Ave
- 11781 Lamplighter St
- 6801 Chapman Ave
- 11634 Talaud St
- 11580 Panay St
- 6861 Reefton Ave
- 12202 Wutzke St
- 6212 Santa Rita Ave
- 11474 Shippigan Way
- 6897 Leilani Ln
- 6906 Molokai Dr
- 6056 Palau St
- 11390 Nantucket Ct
- 6414 Anguilla Ave
- 6837 Amelia Way
- 5902 Belgrave Ave
- 6925 Brightwood Ln Unit 108
- 6971 Knollcrest Ln Unit 47
- 6061 Killarney Ave
- 11901 Saint Mark St
- 11842 Wutzke St
- 11872 Wutzke St
- 11851 Carlotta St
- 11871 Carlotta St
- 11841 Carlotta St
- 11832 Wutzke St
- 11882 Wutzke St
- 11881 Carlotta St
- 11831 Carlotta St
- 11841 Wutzke St
- 11871 Wutzke St
- 11892 Wutzke St
- 11822 Wutzke St
- 11831 Wutzke St
- 11891 Carlotta St
- 11881 Wutzke St
- 11821 Carlotta St
- 11812 Wutzke St
- 6511 Santa Monica Ave
- 11902 Wutzke St