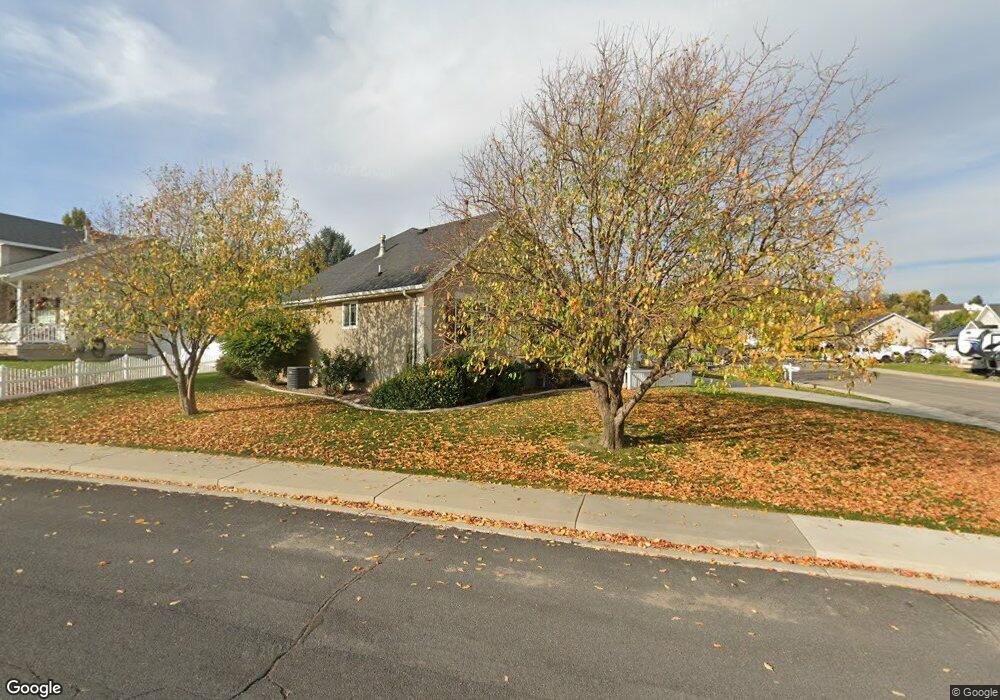
1186 E 470 S Payson, UT 84651
Estimated Value: $535,000 - $570,000
5
Beds
3
Baths
2,970
Sq Ft
$185/Sq Ft
Est. Value
About This Home
This home is located at 1186 E 470 S, Payson, UT 84651 and is currently estimated at $548,271, approximately $184 per square foot. 1186 E 470 S is a home located in Utah County with nearby schools including Barnett Elementary School, Salem Junior High School, and Valley View Middle School.
Ownership History
Date
Name
Owned For
Owner Type
Purchase Details
Closed on
Jul 6, 2020
Sold by
Hardy David I and Hardy Linda M
Bought by
Hardy David I and Hardy Linda M
Current Estimated Value
Home Financials for this Owner
Home Financials are based on the most recent Mortgage that was taken out on this home.
Original Mortgage
$156,500
Interest Rate
3.1%
Mortgage Type
New Conventional
Purchase Details
Closed on
Mar 17, 2014
Sold by
Walbeck Ralph R and Walbeck Marilyn W
Bought by
Hardy David I and Hardy Linda M
Home Financials for this Owner
Home Financials are based on the most recent Mortgage that was taken out on this home.
Original Mortgage
$130,000
Interest Rate
4.29%
Mortgage Type
New Conventional
Purchase Details
Closed on
Nov 5, 2002
Sold by
Stratton Family Trust
Bought by
Walbeck Ralph R and Walbeck Marilyn W
Home Financials for this Owner
Home Financials are based on the most recent Mortgage that was taken out on this home.
Original Mortgage
$118,000
Interest Rate
5.88%
Purchase Details
Closed on
Oct 28, 1999
Sold by
Taylor Homes Associates Inc
Bought by
Stratton John L and Stratton Rosie M
Create a Home Valuation Report for This Property
The Home Valuation Report is an in-depth analysis detailing your home's value as well as a comparison with similar homes in the area
Home Values in the Area
Average Home Value in this Area
Purchase History
| Date | Buyer | Sale Price | Title Company |
|---|---|---|---|
| Hardy David I | -- | Us Title Insurance Agency | |
| Hardy David I | -- | Us Title Insurance Agency | |
| Hardy David I | -- | North American Title | |
| Walbeck Ralph R | -- | First American Title Co | |
| Stratton John L | -- | First American Title Ins Co |
Source: Public Records
Mortgage History
| Date | Status | Borrower | Loan Amount |
|---|---|---|---|
| Previous Owner | Hardy David I | $156,500 | |
| Previous Owner | Hardy David I | $130,000 | |
| Previous Owner | Walbeck Ralph R | $118,000 |
Source: Public Records
Tax History Compared to Growth
Tax History
| Year | Tax Paid | Tax Assessment Tax Assessment Total Assessment is a certain percentage of the fair market value that is determined by local assessors to be the total taxable value of land and additions on the property. | Land | Improvement |
|---|---|---|---|---|
| 2025 | $2,634 | $283,305 | $179,500 | $335,600 |
| 2024 | $2,634 | $268,015 | $0 | $0 |
| 2023 | $2,660 | $271,425 | $0 | $0 |
| 2022 | $2,561 | $257,070 | $0 | $0 |
| 2021 | $2,155 | $347,000 | $117,800 | $229,200 |
| 2020 | $2,013 | $317,000 | $102,400 | $214,600 |
| 2019 | $1,847 | $298,200 | $84,800 | $213,400 |
| 2018 | $1,692 | $263,300 | $77,700 | $185,600 |
| 2017 | $1,638 | $137,115 | $0 | $0 |
| 2016 | $1,570 | $130,515 | $0 | $0 |
| 2015 | $1,414 | $116,765 | $0 | $0 |
| 2014 | $1,241 | $103,235 | $0 | $0 |
Source: Public Records
Map
Nearby Homes
- 585 S 1200 E
- 2363 E 370 St N Unit 7
- 2371 E 370 St N Unit 8
- 2351 E 370 St N Unit 6
- 753 N Emery Ln Unit 57
- 678 N Mountain View Dr
- 552 E Longview Dr Unit 29
- 350 E Meadow Lark Ln Unit 9
- 1000 S Goosenest Dr W
- 643 E Longview Dr Unit 8
- 942 W Wilcock Cove
- 4100 W 12400 S
- 761 N Birch Ln Unit 64
- 554 E Salem Hills Dr S Unit 2
- 61 S Lighthouse Cir Unit 14
- 627 E Birch N Unit 68
- 1287 S 500 E Unit 134
- 526 E Sophie Cir Unit 1
- 700 S Hillside Dr E
- 792 N Mountain Dr