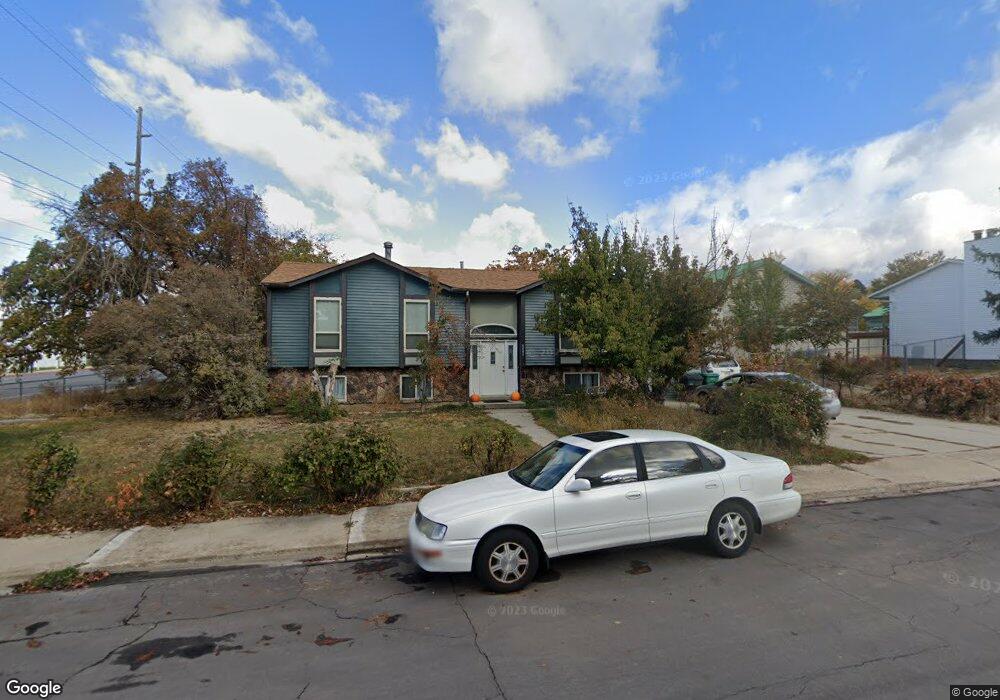
1186 W 640 N Orem, UT 84057
Geneva NeighborhoodEstimated Value: $459,777 - $521,000
3
Beds
2
Baths
1,194
Sq Ft
$409/Sq Ft
Est. Value
About This Home
This home is located at 1186 W 640 N, Orem, UT 84057 and is currently estimated at $488,194, approximately $408 per square foot. 1186 W 640 N is a home located in Utah County with nearby schools including Orem Junior High School, Timpanogos High School, and Franklin Discovery Academy.
Ownership History
Date
Name
Owned For
Owner Type
Purchase Details
Closed on
Jan 29, 2024
Sold by
Rice Mark
Bought by
Blue Arbor Living Trust and Rice
Current Estimated Value
Purchase Details
Closed on
Aug 16, 2000
Sold by
Clements Brenden J and Clements Amy L
Bought by
Toronto Stephen and Toronto Esther
Home Financials for this Owner
Home Financials are based on the most recent Mortgage that was taken out on this home.
Original Mortgage
$139,070
Interest Rate
8.16%
Mortgage Type
FHA
Purchase Details
Closed on
Oct 15, 1997
Sold by
Clements Brenden J and Clements Amy L
Bought by
Clements Brenden J and Clements Amy L
Home Financials for this Owner
Home Financials are based on the most recent Mortgage that was taken out on this home.
Original Mortgage
$105,215
Interest Rate
7.36%
Mortgage Type
FHA
Purchase Details
Closed on
Jun 25, 1996
Sold by
Loveall Bart D
Bought by
Clements Brenden J and Clements Amy L
Home Financials for this Owner
Home Financials are based on the most recent Mortgage that was taken out on this home.
Original Mortgage
$107,362
Interest Rate
8.09%
Mortgage Type
FHA
Create a Home Valuation Report for This Property
The Home Valuation Report is an in-depth analysis detailing your home's value as well as a comparison with similar homes in the area
Home Values in the Area
Average Home Value in this Area
Purchase History
| Date | Buyer | Sale Price | Title Company |
|---|---|---|---|
| Blue Arbor Living Trust | -- | None Listed On Document | |
| Toronto Stephen | -- | Equity Title | |
| Clements Brenden J | -- | -- | |
| Clements Brenden J | -- | -- |
Source: Public Records
Mortgage History
| Date | Status | Borrower | Loan Amount |
|---|---|---|---|
| Previous Owner | Toronto Stephen | $139,070 | |
| Previous Owner | Clements Brenden J | $105,215 | |
| Previous Owner | Clements Brenden J | $107,362 |
Source: Public Records
Tax History
| Year | Tax Paid | Tax Assessment Tax Assessment Total Assessment is a certain percentage of the fair market value that is determined by local assessors to be the total taxable value of land and additions on the property. | Land | Improvement |
|---|---|---|---|---|
| 2025 | $1,816 | $232,760 | -- | -- |
| 2024 | $1,816 | $222,035 | $0 | $0 |
| 2023 | $1,686 | $221,595 | $0 | $0 |
| 2022 | $1,718 | $218,680 | $0 | $0 |
| 2021 | $1,567 | $302,200 | $114,800 | $187,400 |
| 2020 | $1,444 | $273,700 | $91,800 | $181,900 |
| 2019 | $1,385 | $272,900 | $91,800 | $181,100 |
| 2018 | $1,305 | $245,800 | $88,300 | $157,500 |
| 2017 | $1,175 | $118,525 | $0 | $0 |
| 2016 | $1,145 | $106,480 | $0 | $0 |
| 2015 | $1,090 | $95,865 | $0 | $0 |
| 2014 | $1,064 | $93,170 | $0 | $0 |
Source: Public Records
Map
Nearby Homes
- 1058 W 570 St N
- 1094 W 465 N
- 954 W 630 N Unit 34,
- 454 N 1235 W
- 1140 W 950 N Unit D302
- 1140 W 950 N Unit E202
- 1140 W 950 N Unit D304
- 875 W 530 N
- 930 N 980 W
- 686 N 835 W
- 222 N 1200 W Unit 144
- 222 N 1200 W Unit 53
- 222 N 1200 W Unit 84
- 1004 N 1090 W Unit 203
- 1015 N 995 W
- 776 W 640 N
- 557 N Emery Ave
- 489 N Beverly Ave
- 999 W 1100 N
- 474 N Emery Ave
Your Personal Tour Guide
Ask me questions while you tour the home.