11869 E Crescent St Desert Hot Springs, CA 92240
Estimated Value: $435,599 - $463,000
3
Beds
2
Baths
1,946
Sq Ft
$232/Sq Ft
Est. Value
About This Home
This home is located at 11869 E Crescent St, Desert Hot Springs, CA 92240 and is currently estimated at $451,150, approximately $231 per square foot. 11869 E Crescent St is a home with nearby schools including Painted Hills Middle School and Desert Hot Springs High School.
Ownership History
Date
Name
Owned For
Owner Type
Purchase Details
Closed on
Jan 30, 2023
Sold by
Lennar Homes Of California Llc
Bought by
Justin Susan and Villasenor Eddie
Current Estimated Value
Home Financials for this Owner
Home Financials are based on the most recent Mortgage that was taken out on this home.
Original Mortgage
$312,577
Outstanding Balance
$302,410
Interest Rate
6.13%
Mortgage Type
New Conventional
Estimated Equity
$148,740
Purchase Details
Closed on
Dec 21, 2021
Sold by
Gm Gabrych Family Limited Partnership
Bought by
Skybrone Ventures Llc
Create a Home Valuation Report for This Property
The Home Valuation Report is an in-depth analysis detailing your home's value as well as a comparison with similar homes in the area
Home Values in the Area
Average Home Value in this Area
Purchase History
| Date | Buyer | Sale Price | Title Company |
|---|---|---|---|
| Justin Susan | $417,000 | Lennar Title | |
| Skybrone Ventures Llc | $6,800,000 | First American Title Company |
Source: Public Records
Mortgage History
| Date | Status | Borrower | Loan Amount |
|---|---|---|---|
| Open | Justin Susan | $312,577 |
Source: Public Records
Tax History Compared to Growth
Tax History
| Year | Tax Paid | Tax Assessment Tax Assessment Total Assessment is a certain percentage of the fair market value that is determined by local assessors to be the total taxable value of land and additions on the property. | Land | Improvement |
|---|---|---|---|---|
| 2025 | $7,477 | $433,604 | $104,037 | $329,567 |
| 2023 | $7,477 | $363,804 | $82,804 | $281,000 |
| 2022 | $1,171 | $72,800 | $72,800 | $0 |
| 2021 | $490 | $20,405 | $20,405 | $0 |
| 2020 | $474 | $20,196 | $20,196 | $0 |
| 2019 | $407 | $15,000 | $15,000 | $0 |
| 2018 | $399 | $14,706 | $14,706 | $0 |
| 2017 | $384 | $14,418 | $14,418 | $0 |
| 2016 | $375 | $14,136 | $14,136 | $0 |
| 2015 | $219 | $13,925 | $13,925 | $0 |
| 2014 | $218 | $13,653 | $13,653 | $0 |
Source: Public Records
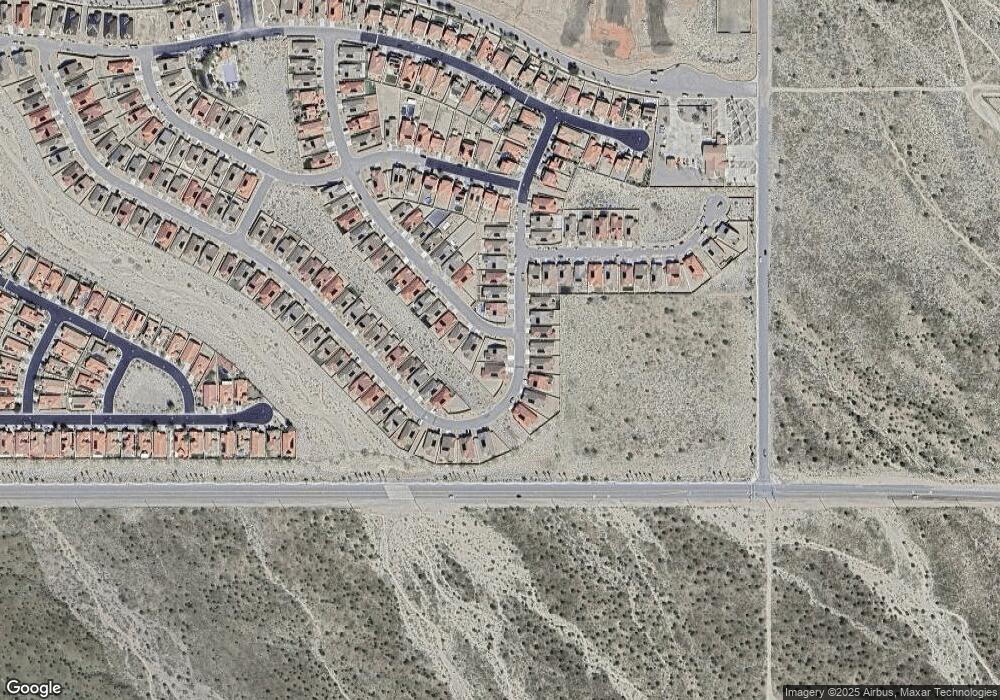
Map
Nearby Homes
- 11689 S Crescent St
- 11664 S Crescent St
- 62880 Loftwood St
- 62892 Loftwood St
- 11588 Sky Pointe Dr
- 62819 N Crescent St
- 62802 N Crescent St
- 11603 S Crescent St
- 62691 Rainbow Ln
- 62687 Rainbow Ln
- 62683 Rainbow Ln
- 11597 S Crescent St
- 62679 Rainbow Ln
- 62675 Rainbow Ln
- 11357 N Star Ln
- 11365 N Star Ln
- 11576 S Crescent St
- 11875 Morning Star Dr
- 11382 N Star Ln
- 11377 N Star Ln
- 11853 E Crescent St
- 11866 E Crescent St
- 11854 E Crescent St
- 11860 E Crescent St
- 11872 E Crescent St
- 11884 E Crescent St
- 11878 E Crescent St
- 11663 Sky Pointe Dr
- 11843 E Crescent St
- 11843 E Crescent
- 11659 Sky Pointe Dr
- 11686 S Crescent St
- 11680 S Crescent St
- 62873 Loftwood St
- 11839 E Crescent St
- 11676 S Crescent St
- 11653 Sky Pointe Dr
- 11699 S Crescent St
- 62877 Loftwood St
- 11652 Sky Pointe Dr