Estimated Value: $496,000 - $530,000
4
Beds
4
Baths
3,169
Sq Ft
$162/Sq Ft
Est. Value
About This Home
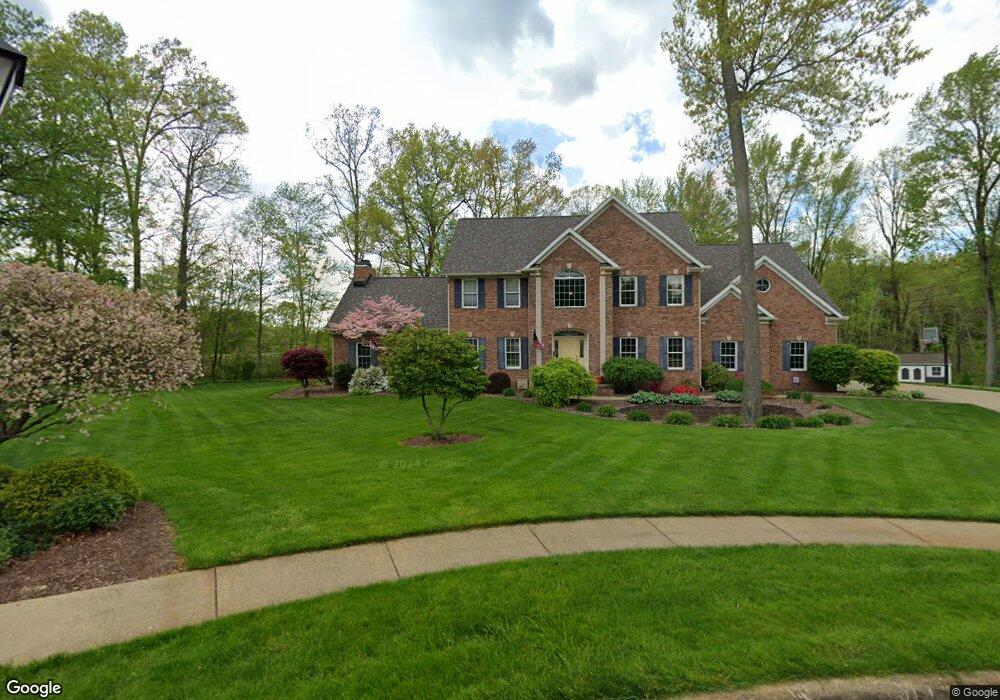
This home is located at 1187 Maxfli Dr, Akron, OH 44312 and is currently estimated at $513,899, approximately $162 per square foot. 1187 Maxfli Dr is a home located in Summit County with nearby schools including Springfield High School, Chapel Hill Christian School-Green Campus, and Academy of the Immaculate Heart of Mary.
Ownership History
Date
Name
Owned For
Owner Type
Purchase Details
Closed on
Sep 27, 2021
Sold by
Bindreiter Harold A
Bought by
Bindreiter Harold A and Bindreiter Harold A
Current Estimated Value
Home Financials for this Owner
Home Financials are based on the most recent Mortgage that was taken out on this home.
Original Mortgage
$138,000
Outstanding Balance
$73,540
Interest Rate
2.8%
Mortgage Type
New Conventional
Estimated Equity
$440,359
Purchase Details
Closed on
Nov 19, 2012
Sold by
Bindreiter Harold A
Bought by
Bindreiter Harold A and Harold A Bindreiter Revocable Living Tru
Purchase Details
Closed on
Feb 18, 2004
Sold by
Bindreiter Julie C
Bought by
Bindreiter Harold A
Purchase Details
Closed on
Nov 7, 1997
Sold by
Wayne Breitenstine Build
Bought by
Bindreiter Et Al Harold A Bindreiter
Create a Home Valuation Report for This Property
The Home Valuation Report is an in-depth analysis detailing your home's value as well as a comparison with similar homes in the area
Purchase History
| Date | Buyer | Sale Price | Title Company |
|---|---|---|---|
| Bindreiter Harold A | -- | Amrock | |
| Bindreiter Harold A | -- | None Available | |
| Bindreiter Harold A | -- | None Available | |
| Bindreiter Harold A | -- | -- | |
| Bindreiter Et Al Harold A Bindreiter | $44,500 | -- |
Source: Public Records
Mortgage History
| Date | Status | Borrower | Loan Amount |
|---|---|---|---|
| Open | Bindreiter Harold A | $138,000 |
Source: Public Records
Tax History
| Year | Tax Paid | Tax Assessment Tax Assessment Total Assessment is a certain percentage of the fair market value that is determined by local assessors to be the total taxable value of land and additions on the property. | Land | Improvement |
|---|---|---|---|---|
| 2024 | $8,160 | $145,146 | $34,521 | $110,625 |
| 2023 | $8,160 | $145,146 | $34,521 | $110,625 |
| 2022 | $7,494 | $115,196 | $27,398 | $87,798 |
| 2021 | $7,319 | $115,196 | $27,398 | $87,798 |
| 2020 | $7,216 | $115,200 | $27,400 | $87,800 |
| 2019 | $7,049 | $104,310 | $19,410 | $84,900 |
| 2018 | $6,774 | $104,310 | $19,410 | $84,900 |
| 2017 | $5,817 | $104,310 | $19,410 | $84,900 |
| 2016 | $5,817 | $85,690 | $19,410 | $66,280 |
| 2015 | $5,817 | $85,690 | $19,410 | $66,280 |
| 2014 | $5,748 | $85,690 | $19,410 | $66,280 |
| 2013 | $5,766 | $86,430 | $19,410 | $67,020 |
Source: Public Records
Map
Nearby Homes
- 1238 Maxfli Dr
- 1254 Maxfli Dr
- 2872 Ironwood Dr
- 1086 Saint Andrew's Ct
- 2729 Ariels Way
- 2828 Steelwood Cir
- 2837 Stratford Cir
- 1088 Buena Vista Dr
- 0 Fortuna Dr Unit 5005346
- S/L 43 Park Ave
- 1031 Archmere Dr
- 3108 Vermont Place
- 1457 5th Ave
- 1702 Far View Rd
- 3218 Pickle Rd
- 1134 E Turkeyfoot Lake Rd
- 619 Moore Rd
- 2690 Mayfair Rd
- 3374 Buckeye Trail
- 3375 Buckeye Trail
- 1195 Maxfli Dr
- 1186 Maxfli Dr
- 1203 Maxfli Dr
- 1194 Maxfli Dr
- 1221 Maxfli Dr
- 1202 Maxfli Dr
- 1220 Maxfli Dr
- 1239 Maxfli Dr
- 1247 Maxfli Dr
- 1246 Maxfli Dr
- 1255 Maxfli Dr
- 1160 Killian Rd
- 2969 Edgar Ln
- 2969 Edgar Ln
- 1170 1/2 Killian Rd
- 1263 Maxfli Dr
- 1262 Maxfli Dr
- 1289 Titleist Dr
- 1271 Maxfli Dr
- 1270 Maxfli Dr
Your Personal Tour Guide
Ask me questions while you tour the home.