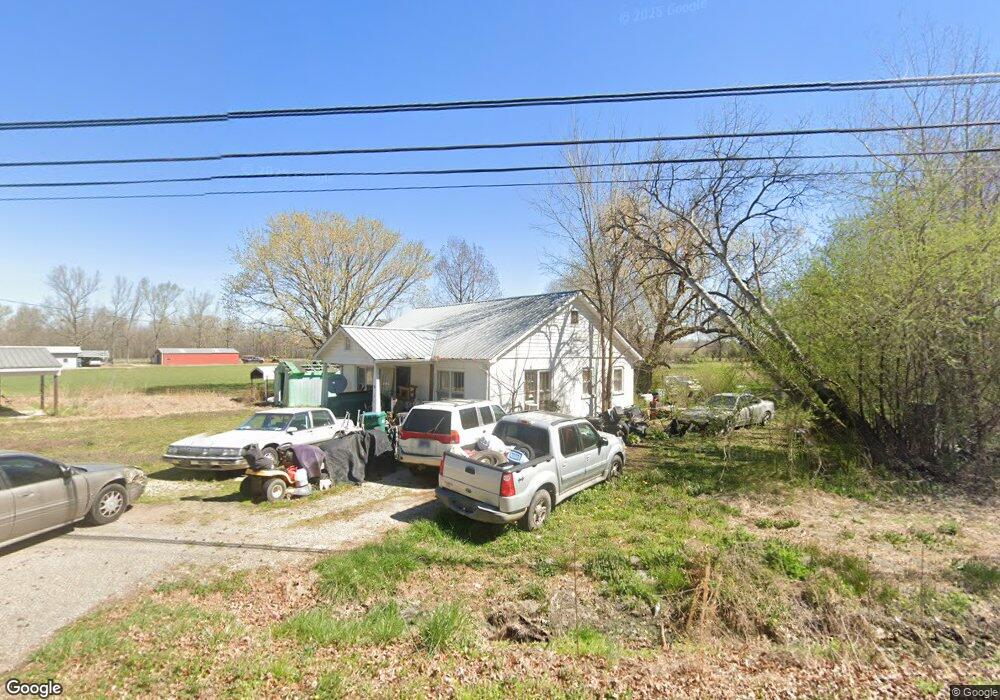
11870 Lexington St Huntingdon, TN 38344
Estimated Value: $65,000 - $112,000
--
Bed
1
Bath
960
Sq Ft
$83/Sq Ft
Est. Value
About This Home
This home is located at 11870 Lexington St, Huntingdon, TN 38344 and is currently estimated at $79,358, approximately $82 per square foot. 11870 Lexington St is a home located in Carroll County with nearby schools including Huntingdon Primary School, Huntingdon Middle School, and Huntingdon High School.
Ownership History
Date
Name
Owned For
Owner Type
Purchase Details
Closed on
Dec 27, 2013
Sold by
Mcclure Johnny L
Bought by
Hillsman Kenneth J and Hillsman Ruby F
Current Estimated Value
Purchase Details
Closed on
Oct 29, 2008
Sold by
Bailey Samuel D
Bought by
Mcclure Johnny L
Purchase Details
Closed on
Apr 9, 2002
Sold by
Crider Charles
Bought by
Bailey Samuel D
Purchase Details
Closed on
Jun 24, 1991
Bought by
Crider Charles
Purchase Details
Closed on
Aug 14, 1967
Bought by
Roark Elmer and Roark Florence
Create a Home Valuation Report for This Property
The Home Valuation Report is an in-depth analysis detailing your home's value as well as a comparison with similar homes in the area
Home Values in the Area
Average Home Value in this Area
Purchase History
| Date | Buyer | Sale Price | Title Company |
|---|---|---|---|
| Hillsman Kenneth J | $20,000 | -- | |
| Mcclure Johnny L | $20,000 | -- | |
| Bailey Samuel D | $15,000 | -- | |
| Crider Charles | $13,000 | -- | |
| Roark Elmer | -- | -- |
Source: Public Records
Tax History Compared to Growth
Tax History
| Year | Tax Paid | Tax Assessment Tax Assessment Total Assessment is a certain percentage of the fair market value that is determined by local assessors to be the total taxable value of land and additions on the property. | Land | Improvement |
|---|---|---|---|---|
| 2025 | $327 | $13,900 | $0 | $0 |
| 2024 | $327 | $8,650 | $3,450 | $5,200 |
| 2023 | $327 | $8,650 | $3,450 | $5,200 |
| 2022 | $327 | $8,650 | $3,450 | $5,200 |
| 2021 | $230 | $8,650 | $3,450 | $5,200 |
| 2020 | $327 | $8,650 | $3,450 | $5,200 |
| 2019 | $326 | $7,900 | $3,450 | $4,450 |
| 2018 | $326 | $7,900 | $3,450 | $4,450 |
| 2017 | $326 | $7,900 | $3,450 | $4,450 |
| 2016 | $412 | $7,900 | $3,450 | $4,450 |
| 2015 | $293 | $7,900 | $3,450 | $4,450 |
| 2014 | $305 | $7,900 | $3,450 | $4,450 |
| 2013 | $305 | $7,314 | $0 | $0 |
Source: Public Records
Map
Nearby Homes
- 20100 E Main St
- 00 Sportsman Cove Lot 12
- 260 Cotham Dr
- 119 5th Ave
- Lot 7 Stately Oak Dr
- 159 Court Square
- 170 Browning Ave
- 231 Northwood Dr
- 194 Spring St
- 1085 Purdy Rd
- 414 Knox St
- 195 Noles Ln
- 18810 Main St W
- 325 Knox St
- 18790 Main St W
- 13120 Paris St
- 0 Shoreline Dr Unit RTC2922326
- 0 Shoreline Dr Unit RTC2922320
- 0 Shoreline Dr Unit RTC2680464
- 253 Knox St
- 11890 Lexington St
- 11900 Lexington St
- 11815 Lexington St
- 11940 Lexington St
- 15895 Highway 70 E
- 11995 Lexington St
- 11670 Lexington St
- 11652 Lexington St
- 11635 Lexington St
- 12090 Lexington St
- 11620 Lexington St
- 11605 Lexington St
- 11610 Lexington St
- 11580 Lexington St
- 11555 Lexington St
- 11560 Lexington St
- 11530 Lexington St
- 11495 Lexington St
- 11465 Lexington St
- 11435 Lexington St