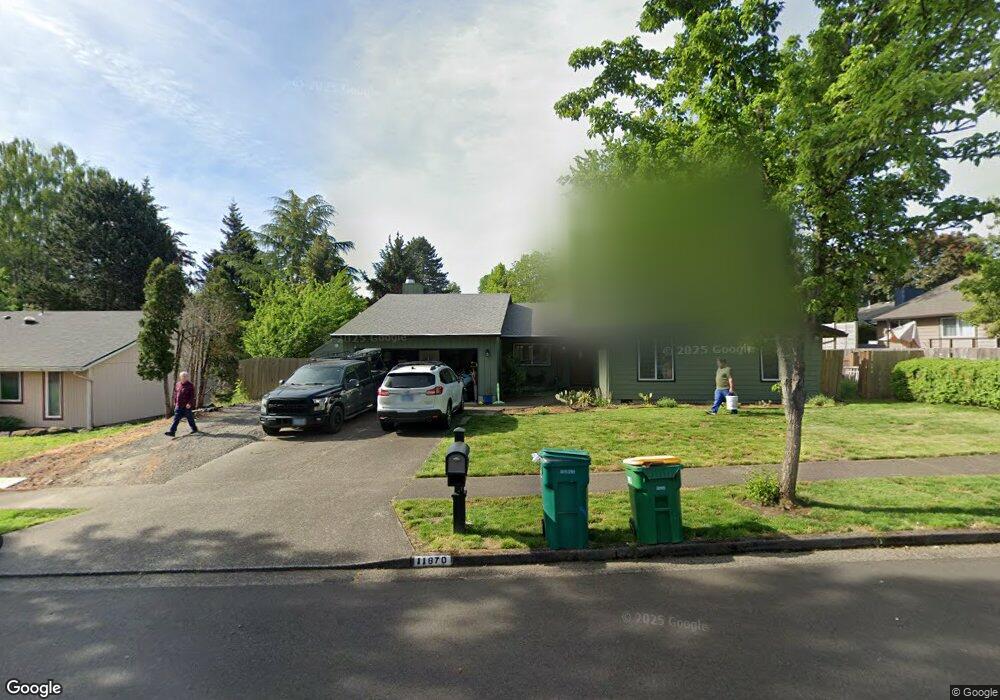
11870 SW Wilkens Ln Beaverton, OR 97008
Greenway NeighborhoodEstimated Value: $603,000 - $686,267
4
Beds
3
Baths
2,318
Sq Ft
$283/Sq Ft
Est. Value
About This Home
This home is located at 11870 SW Wilkens Ln, Beaverton, OR 97008 and is currently estimated at $655,567, approximately $282 per square foot. 11870 SW Wilkens Ln is a home located in Washington County with nearby schools including Greenway Elementary School, Conestoga Middle School, and Southridge High School.
Ownership History
Date
Name
Owned For
Owner Type
Purchase Details
Closed on
Oct 18, 2012
Sold by
Gould Gayle
Bought by
Powers Deena
Current Estimated Value
Home Financials for this Owner
Home Financials are based on the most recent Mortgage that was taken out on this home.
Original Mortgage
$163,440
Outstanding Balance
$112,422
Interest Rate
3.52%
Mortgage Type
VA
Estimated Equity
$543,145
Purchase Details
Closed on
Oct 17, 2012
Sold by
Powers Deena and Powers Deena J
Bought by
Powers Mark Edward and Powers Deena J
Home Financials for this Owner
Home Financials are based on the most recent Mortgage that was taken out on this home.
Original Mortgage
$163,440
Outstanding Balance
$112,422
Interest Rate
3.52%
Mortgage Type
VA
Estimated Equity
$543,145
Purchase Details
Closed on
Jul 5, 2012
Sold by
Metz Alden
Bought by
Metz Alden and Gould Gayle
Create a Home Valuation Report for This Property
The Home Valuation Report is an in-depth analysis detailing your home's value as well as a comparison with similar homes in the area
Home Values in the Area
Average Home Value in this Area
Purchase History
| Date | Buyer | Sale Price | Title Company |
|---|---|---|---|
| Powers Deena | $70,000 | First American | |
| Powers Mark Edward | -- | First American | |
| Powers Deena | $70,000 | First American | |
| Metz Alden | -- | None Available |
Source: Public Records
Mortgage History
| Date | Status | Borrower | Loan Amount |
|---|---|---|---|
| Open | Powers Deena | $163,440 |
Source: Public Records
Tax History Compared to Growth
Tax History
| Year | Tax Paid | Tax Assessment Tax Assessment Total Assessment is a certain percentage of the fair market value that is determined by local assessors to be the total taxable value of land and additions on the property. | Land | Improvement |
|---|---|---|---|---|
| 2026 | $6,654 | $324,840 | -- | -- |
| 2025 | $6,654 | $315,380 | -- | -- |
| 2024 | $6,283 | $306,200 | -- | -- |
| 2023 | $6,283 | $297,290 | $0 | $0 |
| 2022 | $6,013 | $297,290 | $0 | $0 |
| 2021 | $5,803 | $280,240 | $0 | $0 |
| 2020 | $5,626 | $272,080 | $0 | $0 |
| 2019 | $5,448 | $264,160 | $0 | $0 |
| 2018 | $4,990 | $242,620 | $0 | $0 |
| 2017 | $4,803 | $235,560 | $0 | $0 |
| 2016 | $4,167 | $205,560 | $0 | $0 |
| 2015 | $4,012 | $199,580 | $0 | $0 |
| 2014 | $3,927 | $193,770 | $0 | $0 |
Source: Public Records
Map
Nearby Homes
- 12145 SW Gingham Ln
- 11625 SW Settler Way
- 9750 SW Lookout Terrace
- 9964 SW Trapper Terrace Unit 259
- 12062 SW Conestoga Dr Unit 6
- 9400 SW Downing Dr
- 10137 SW Trapper Terrace
- 10196 SW Trapper Terrace Unit 165
- 10322 SW Trapper Terrace Unit 339D
- 11640 SW Boones Bend Dr
- 11746 SW Boones Bend Dr
- 11724 SW Boones Bend Dr
- 11656 SW Boones Bend Dr
- 11255 SW Springwood Dr Unit 3
- 8670 SW Indian Hill Ln
- 9625 SW 130th Ave
- 18971 SW Hazelwood Loop Unit L-4
- 9020 SW 130th Ave Unit 9020
- 12945 SW Hackamore Ct
- 13250 SW Weir Rd
- 11840 SW Wilkens Ln
- 9670 SW Robbins Dr
- 9700 SW Robbins Dr
- 9720 SW Robbins Dr
- 11800 SW Wilkens Ln
- 11865 SW Ebberts Ct
- 11835 SW Ebberts Ct
- 11865 SW Wilkens Ln
- 11745 SW Ebberts Ct
- 11835 SW Wilkens Ln
- 9630 SW Robbins Dr
- 11805 SW Wilkens Ln
- 9740 SW Robbins Dr
- 11770 SW Wilkens Ln
- 9695 SW Robbins Dr
- 9665 SW Robbins Dr
- 11785 SW Wilkens Ln
- 9600 SW Robbins Dr
- 9715 SW Robbins Dr
- 9635 SW Robbins Dr