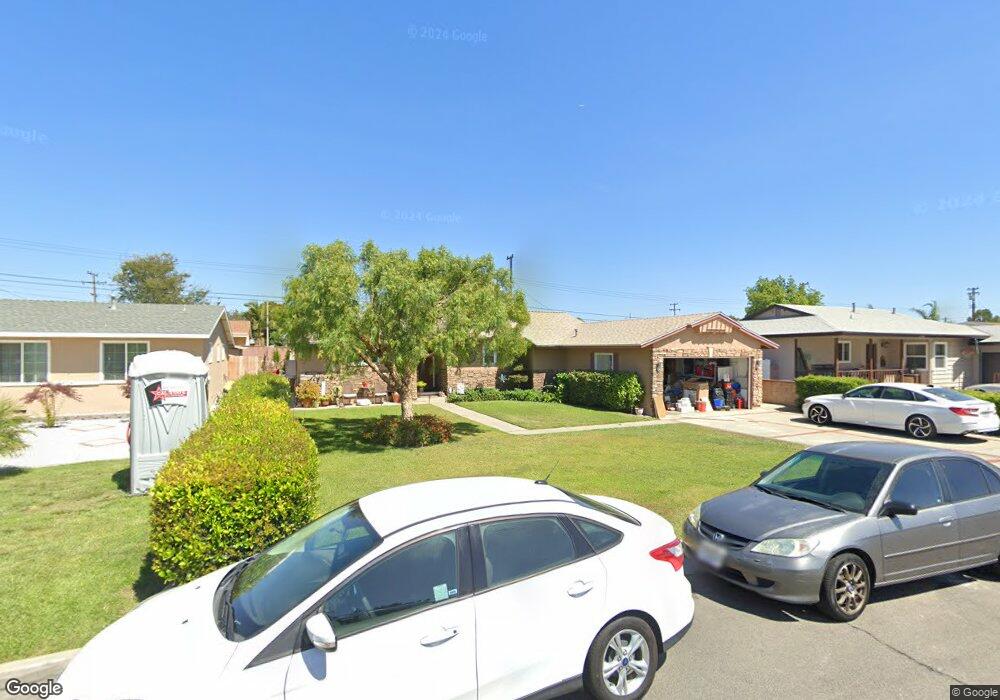
11872 Morgan Ln Garden Grove, CA 92840
Estimated Value: $861,000 - $968,000
3
Beds
2
Baths
1,183
Sq Ft
$772/Sq Ft
Est. Value
About This Home
This home is located at 11872 Morgan Ln, Garden Grove, CA 92840 and is currently estimated at $913,218, approximately $771 per square foot. 11872 Morgan Ln is a home located in Orange County with nearby schools including Parkview Elementary, Lake Intermediate School, and Garden Grove High School.
Ownership History
Date
Name
Owned For
Owner Type
Purchase Details
Closed on
Aug 16, 2016
Sold by
Cedeno Sergio and Cedeno Elsa S
Bought by
Cedeno Sergio M and Cedeno Elsa S
Current Estimated Value
Purchase Details
Closed on
Oct 4, 2001
Sold by
Curry Glen
Bought by
Cedeno Sergio and Cedeno Elsa S
Home Financials for this Owner
Home Financials are based on the most recent Mortgage that was taken out on this home.
Original Mortgage
$237,473
Outstanding Balance
$91,868
Interest Rate
6.73%
Mortgage Type
FHA
Estimated Equity
$821,350
Purchase Details
Closed on
May 1, 1998
Sold by
Siska Robert C and Siska Denise A
Bought by
Curry Glen
Home Financials for this Owner
Home Financials are based on the most recent Mortgage that was taken out on this home.
Original Mortgage
$155,600
Interest Rate
7.17%
Purchase Details
Closed on
Feb 5, 1993
Sold by
Siska Robert C
Bought by
Siska Robert C and Siska Denise A
Create a Home Valuation Report for This Property
The Home Valuation Report is an in-depth analysis detailing your home's value as well as a comparison with similar homes in the area
Home Values in the Area
Average Home Value in this Area
Purchase History
| Date | Buyer | Sale Price | Title Company |
|---|---|---|---|
| Cedeno Sergio M | -- | None Available | |
| Cedeno Sergio | $241,500 | Commonwealth Land Title | |
| Curry Glen | $173,000 | Southland Title Company | |
| Siska Robert C | -- | -- |
Source: Public Records
Mortgage History
| Date | Status | Borrower | Loan Amount |
|---|---|---|---|
| Open | Cedeno Sergio | $237,473 | |
| Previous Owner | Curry Glen | $155,600 |
Source: Public Records
Tax History Compared to Growth
Tax History
| Year | Tax Paid | Tax Assessment Tax Assessment Total Assessment is a certain percentage of the fair market value that is determined by local assessors to be the total taxable value of land and additions on the property. | Land | Improvement |
|---|---|---|---|---|
| 2025 | $6,488 | $356,315 | $291,703 | $64,612 |
| 2024 | $6,488 | $349,329 | $285,983 | $63,346 |
| 2023 | $6,403 | $342,480 | $280,376 | $62,104 |
| 2022 | $6,302 | $335,765 | $274,878 | $60,887 |
| 2021 | $6,242 | $329,182 | $269,488 | $59,694 |
| 2020 | $4,305 | $325,807 | $266,725 | $59,082 |
| 2019 | $4,249 | $319,419 | $261,495 | $57,924 |
| 2018 | $4,147 | $313,156 | $256,367 | $56,789 |
| 2017 | $4,104 | $307,016 | $251,340 | $55,676 |
| 2016 | $3,903 | $300,997 | $246,412 | $54,585 |
| 2015 | $3,853 | $296,476 | $242,710 | $53,766 |
| 2014 | $3,764 | $290,669 | $237,956 | $52,713 |
Source: Public Records
Map
Nearby Homes
- 11731 Rose Dr
- 405 13181 Lampson
- 11531 West St
- 11531 Kathy Ln
- 12246 Nadine Cir
- 11841 Shetland Rd
- 827 W Orangewood Ave
- 11402 Morgan Ln
- 11401 Kathy Ln
- 11341 Jacalene Ln
- 11552 9th St
- 2134 S Acama St
- 12081 Bangor St
- 2115 1/2 S Broden St
- 423 W Summerfield Cir Unit 87
- 2115 S Broden St
- 12688 Chapman Ave Unit 3403
- 12664 Chapman Ave Unit 1208
- 12668 Chapman Ave Unit 2313
- 12668 Chapman Ave Unit 2108
- 11862 Morgan Ln
- 11882 Morgan Ln
- 11871 West St
- 11861 West St
- 11881 West St
- 11902 Morgan Ln
- 11852 Morgan Ln
- 11881 Morgan Ln
- 11861 Morgan Ln
- 11901 West St
- 11851 West St
- 11912 Morgan Ln
- 11851 Morgan Ln
- 11911 Candy Ln
- 11962 Donna Ln
- 11952 Donna Ln
- 11911 West St
- 11972 Donna Ln
- 11841 Morgan Ln
- 11922 Candy Ln