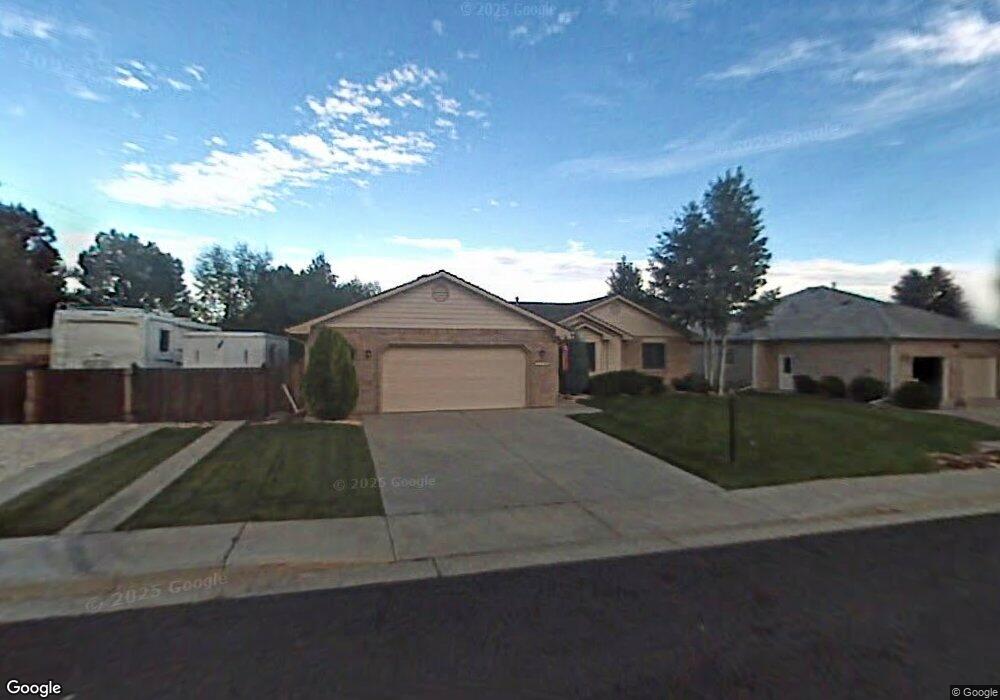
1188 Kayla Ct Loveland, CO 80537
Estimated Value: $591,965 - $672,000
3
Beds
3
Baths
2,985
Sq Ft
$211/Sq Ft
Est. Value
About This Home
This home is located at 1188 Kayla Ct, Loveland, CO 80537 and is currently estimated at $630,491, approximately $211 per square foot. 1188 Kayla Ct is a home located in Larimer County with nearby schools including Namaqua Elementary School, Walt Clark Middle School, and Thompson Valley High School.
Ownership History
Date
Name
Owned For
Owner Type
Purchase Details
Closed on
Jul 20, 2017
Sold by
Miller Susan Deanne
Bought by
Miller Maury Lynn
Current Estimated Value
Home Financials for this Owner
Home Financials are based on the most recent Mortgage that was taken out on this home.
Original Mortgage
$193,325
Outstanding Balance
$162,185
Interest Rate
4.25%
Mortgage Type
FHA
Estimated Equity
$468,306
Purchase Details
Closed on
Jun 1, 2017
Sold by
Wagner Shelly Dee
Bought by
Miller Susan Deanne
Home Financials for this Owner
Home Financials are based on the most recent Mortgage that was taken out on this home.
Original Mortgage
$193,325
Outstanding Balance
$162,185
Interest Rate
4.25%
Mortgage Type
FHA
Estimated Equity
$468,306
Purchase Details
Closed on
Aug 4, 2006
Sold by
Krauer Nancy M
Bought by
Miller Larry D and Miller Karen C
Purchase Details
Closed on
Apr 1, 1994
Sold by
Weinland Homes Inc
Bought by
Krauer Nancy M
Purchase Details
Closed on
Nov 1, 1993
Sold by
Morgan Howard D
Bought by
Weinland Homes Inc
Create a Home Valuation Report for This Property
The Home Valuation Report is an in-depth analysis detailing your home's value as well as a comparison with similar homes in the area
Home Values in the Area
Average Home Value in this Area
Purchase History
| Date | Buyer | Sale Price | Title Company |
|---|---|---|---|
| Miller Maury Lynn | $395,000 | Land Title Guarantee Company | |
| Miller Susan Deanne | -- | None Available | |
| Miller Larry D | $290,000 | Chicago Title Co | |
| Krauer Nancy M | $145,700 | -- | |
| Weinland Homes Inc | $25,900 | -- |
Source: Public Records
Mortgage History
| Date | Status | Borrower | Loan Amount |
|---|---|---|---|
| Open | Miller Maury Lynn | $193,325 |
Source: Public Records
Tax History Compared to Growth
Tax History
| Year | Tax Paid | Tax Assessment Tax Assessment Total Assessment is a certain percentage of the fair market value that is determined by local assessors to be the total taxable value of land and additions on the property. | Land | Improvement |
|---|---|---|---|---|
| 2025 | $3,063 | $42,063 | $4,690 | $37,373 |
| 2024 | $2,954 | $42,063 | $4,690 | $37,373 |
| 2022 | $2,627 | $33,013 | $4,865 | $28,148 |
| 2021 | $2,699 | $33,963 | $5,005 | $28,958 |
| 2020 | $2,378 | $29,908 | $5,005 | $24,903 |
| 2019 | $2,338 | $29,908 | $5,005 | $24,903 |
| 2018 | $2,217 | $26,942 | $5,040 | $21,902 |
| 2017 | $1,909 | $26,942 | $5,040 | $21,902 |
| 2016 | $1,798 | $24,517 | $5,572 | $18,945 |
| 2015 | $1,783 | $24,510 | $5,570 | $18,940 |
| 2014 | $1,686 | $22,420 | $4,220 | $18,200 |
Source: Public Records
Map
Nearby Homes
- 1304 Pine St
- 1682 Stove Prairie Cir
- 2387 W U S 34
- 1670 Stove Prairie Cir
- 1131 W Broadmoor Dr
- 1125 W Broadmoor Dr
- 1209 E Broadmoor Dr
- 1506 N Empire Ave
- 1726 Kennedy Ave
- 1942 Lakewood Dr
- 2467 Farisita Dr
- 1633 Van Buren Ave Unit 1
- 2002 Falls Ct
- 1812 Van Buren Ave
- 901 W Kelly Dr
- 2217 Durango Dr
- 2216 Durango Dr
- 1607 W U S 34
- 2264 Durango Dr
- 1714 W 8th St
- 1164 Kayla Ct
- 1165 Milner Ave
- 2812 Gateway Dr
- 1189 Kayla Ct
- 2808 Gateway Dr
- 1107 Milner Ave
- 1165 Kayla Ct
- 2816 Gateway Dr
- 2714 Zachary Dr
- 2738 Zachary Dr
- 2682 Zachary Dr
- 2820 Gateway Dr
- 1166 Milner Ave
- 2775 Imperial Ridge Dr
- 1262 Milner Ave
- 2763 Imperial Ridge Dr
- 2765 Zachary Dr
- 1051 Milner Ave
- 2811 Gateway Dr
- 2813 Gateway Dr