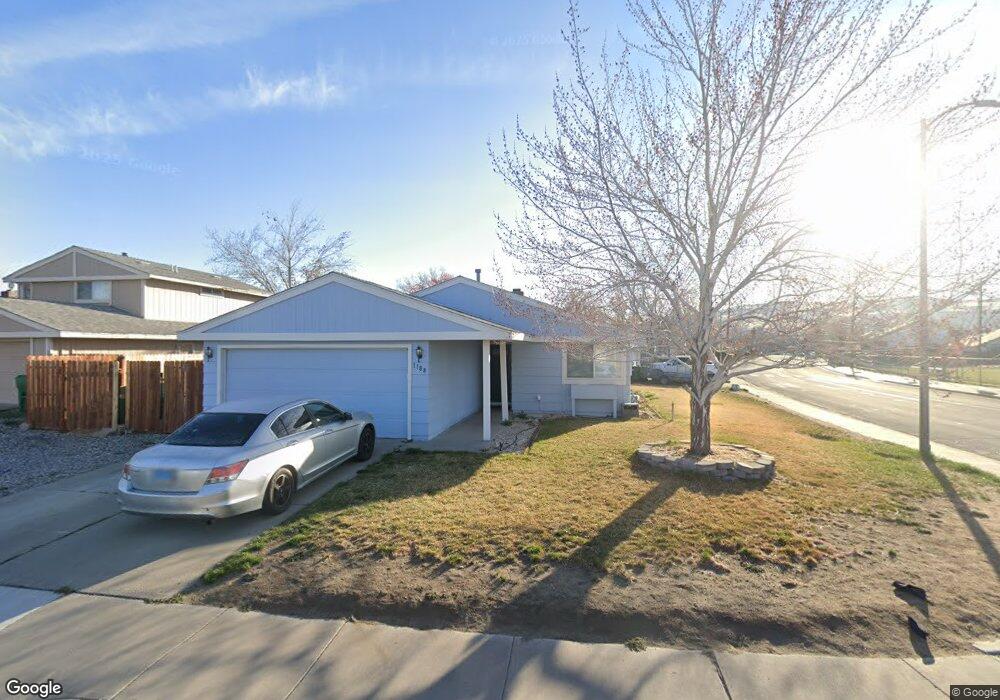
1188 O Callaghan Ct Sparks, NV 89434
O'Callaghan NeighborhoodEstimated Value: $365,000 - $401,272
2
Beds
1
Bath
985
Sq Ft
$390/Sq Ft
Est. Value
About This Home
This home is located at 1188 O Callaghan Ct, Sparks, NV 89434 and is currently estimated at $384,318, approximately $390 per square foot. 1188 O Callaghan Ct is a home located in Washoe County with nearby schools including Katherine Dunn Elementary School, George L Dilworth Middle School, and Edward C Reed High School.
Ownership History
Date
Name
Owned For
Owner Type
Purchase Details
Closed on
Dec 20, 2024
Sold by
Lindsey William and Miramontes Jamie
Bought by
Hallahan Jason Michael and Hallahan Susan Diane
Current Estimated Value
Purchase Details
Closed on
Sep 8, 2021
Sold by
Read David A and Read Linda A
Bought by
Lindsey William and Miramontes Jamie
Home Financials for this Owner
Home Financials are based on the most recent Mortgage that was taken out on this home.
Original Mortgage
$326,477
Interest Rate
2.8%
Mortgage Type
FHA
Purchase Details
Closed on
Apr 29, 2021
Sold by
Pratt Shannon and Pratt Robert S
Bought by
Read David A and The David A Read Family Trust
Purchase Details
Closed on
Jun 4, 2014
Sold by
Pratt Elnora
Bought by
Pratt Robert Stephen and Pratt Roland Leslie
Purchase Details
Closed on
May 16, 2003
Sold by
Pratt Robert A
Bought by
Pratt Elnora
Create a Home Valuation Report for This Property
The Home Valuation Report is an in-depth analysis detailing your home's value as well as a comparison with similar homes in the area
Home Values in the Area
Average Home Value in this Area
Purchase History
| Date | Buyer | Sale Price | Title Company |
|---|---|---|---|
| Hallahan Jason Michael | $385,000 | Core Title Group | |
| Lindsey William | $332,500 | First Centennial Reno | |
| Read David A | $265,000 | First Centennial Title Reno | |
| Pratt Shannon | $33,018 | First Centennial Reno | |
| Pratt Robert Stephen | -- | None Available | |
| Pratt Elnora | -- | -- |
Source: Public Records
Mortgage History
| Date | Status | Borrower | Loan Amount |
|---|---|---|---|
| Previous Owner | Lindsey William | $326,477 |
Source: Public Records
Tax History Compared to Growth
Tax History
| Year | Tax Paid | Tax Assessment Tax Assessment Total Assessment is a certain percentage of the fair market value that is determined by local assessors to be the total taxable value of land and additions on the property. | Land | Improvement |
|---|---|---|---|---|
| 2025 | $1,214 | $54,162 | $37,275 | $16,888 |
| 2024 | $1,214 | $49,281 | $32,620 | $16,661 |
| 2023 | $1,124 | $47,124 | $31,710 | $15,414 |
| 2022 | $1,044 | $40,773 | $27,475 | $13,298 |
| 2021 | $967 | $34,869 | $21,175 | $13,694 |
| 2020 | $937 | $34,669 | $20,510 | $14,159 |
| 2019 | $1,678 | $32,965 | $18,865 | $14,100 |
| 2018 | $1,876 | $27,590 | $13,405 | $14,185 |
| 2017 | $859 | $27,383 | $12,810 | $14,573 |
| 2016 | $843 | $27,565 | $12,355 | $15,210 |
| 2015 | $843 | $25,318 | $9,695 | $15,623 |
| 2014 | $818 | $23,865 | $8,435 | $15,430 |
| 2013 | -- | $21,609 | $6,055 | $15,554 |
Source: Public Records
Map
Nearby Homes
- 1970 Woodhaven Ln
- 1897 Bonita Vista Dr
- 1973 Rio Tinto Dr
- 1544 Woodhaven Ln
- 1728 Bluehaven Dr
- 1990 Fargo Way
- 1051 Glen Martin Dr
- 913 Glen Molly Dr
- 1218 Junction Dr
- 1332 Coachman Ct
- 2435 Sycamore Glen Dr Unit 2
- 1095 E York Way
- 2407 Sunny Slope Dr Unit 1
- 1273 Junction Dr
- 2252 Sycamore Glen Dr
- 745 Glen Vista Dr
- 1770 Burnside Dr
- 1128 Bradley Square
- 949 Crestwood Dr Unit 3
- 857 Cherry Tree Dr Unit 3
- 1178 O Callaghan Ct
- 1198 O Callaghan Dr
- 1853 Rosemary Dr
- 1136 O Callaghan Ct
- 1168 O Callaghan Ct
- 1168 O'Callaghan Ct
- 1138 O Callaghan Ct
- 1144 O Callaghan Ct
- 1913 Rosemary Dr
- 1158 O Callaghan Ct
- 1158 O'Callaghan Ct
- 1824 Rosemary Dr
- 1132 O Callaghan Dr
- 1148 O Callaghan Ct
- 1854 Rosemary Dr
- 1183 Calvados Dr
- 1163 Calvados Dr
- 1193 Calvados Dr
- 1896 Bonita Vista Dr
- 1128 O Callaghan Dr