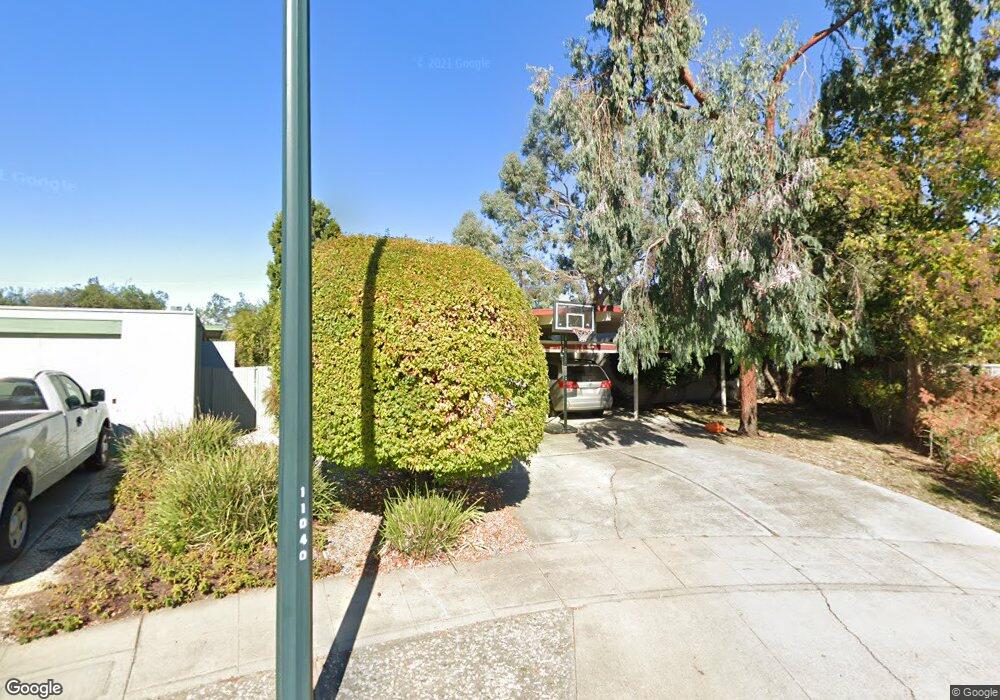
1188 Vanderbilt Ct E Sunnyvale, CA 94087
Estimated Value: $3,047,406 - $3,162,000
4
Beds
2
Baths
1,948
Sq Ft
$1,588/Sq Ft
Est. Value
About This Home
This home is located at 1188 Vanderbilt Ct E, Sunnyvale, CA 94087 and is currently estimated at $3,092,602, approximately $1,587 per square foot. 1188 Vanderbilt Ct E is a home located in Santa Clara County with nearby schools including Cumberland Elementary School, Sunnyvale Middle School, and Fremont High School.
Ownership History
Date
Name
Owned For
Owner Type
Purchase Details
Closed on
Jan 28, 2011
Sold by
Vasquez Valerie A and Genet Vincent M
Bought by
Vasquez Valerie A and Genet Vincent M
Current Estimated Value
Home Financials for this Owner
Home Financials are based on the most recent Mortgage that was taken out on this home.
Original Mortgage
$362,500
Outstanding Balance
$13,968
Interest Rate
4.79%
Mortgage Type
New Conventional
Estimated Equity
$3,078,634
Purchase Details
Closed on
May 19, 2004
Sold by
Vasquez Valerie A and Genet Vincent M
Bought by
Vasquez Valerie A and Genet Vincent M
Purchase Details
Closed on
Apr 11, 2000
Sold by
Trustee Iwanciow Bernard L And Kathleen G and The Iwanciow Family Trust
Bought by
Genet Vincent M and Vasquez Valerie A
Home Financials for this Owner
Home Financials are based on the most recent Mortgage that was taken out on this home.
Original Mortgage
$549,600
Interest Rate
7.75%
Create a Home Valuation Report for This Property
The Home Valuation Report is an in-depth analysis detailing your home's value as well as a comparison with similar homes in the area
Home Values in the Area
Average Home Value in this Area
Purchase History
| Date | Buyer | Sale Price | Title Company |
|---|---|---|---|
| Vasquez Valerie A | -- | First American Title Company | |
| Vasquez Valerie A | -- | First American Title Company | |
| Vasquez Valerie A | -- | -- | |
| Genet Vincent M | $687,000 | First American Title Guarant |
Source: Public Records
Mortgage History
| Date | Status | Borrower | Loan Amount |
|---|---|---|---|
| Open | Vasquez Valerie A | $362,500 | |
| Closed | Genet Vincent M | $549,600 |
Source: Public Records
Tax History Compared to Growth
Tax History
| Year | Tax Paid | Tax Assessment Tax Assessment Total Assessment is a certain percentage of the fair market value that is determined by local assessors to be the total taxable value of land and additions on the property. | Land | Improvement |
|---|---|---|---|---|
| 2025 | $12,180 | $1,055,882 | $633,531 | $422,351 |
| 2024 | $12,180 | $1,035,179 | $621,109 | $414,070 |
| 2023 | $12,039 | $1,014,882 | $608,931 | $405,951 |
| 2022 | $11,811 | $994,984 | $596,992 | $397,992 |
| 2021 | $11,691 | $975,476 | $585,287 | $390,189 |
| 2020 | $11,544 | $965,475 | $579,286 | $386,189 |
| 2019 | $11,287 | $946,545 | $567,928 | $378,617 |
| 2018 | $11,063 | $927,987 | $556,793 | $371,194 |
| 2017 | $10,921 | $909,792 | $545,876 | $363,916 |
| 2016 | $10,472 | $891,954 | $535,173 | $356,781 |
| 2015 | $10,535 | $878,557 | $527,135 | $351,422 |
| 2014 | $10,327 | $861,349 | $516,810 | $344,539 |
Source: Public Records
Map
Nearby Homes
- 1140 Snowberry Ct
- 725 Winstead Terrace
- 654 Princeton Dr
- 839 Springfield Terrace
- 1243 E Fremont Terrace
- 1308 Yarmouth Terrace
- Plan 7 at Vida
- Plan 4 at Vida
- Plan 2 at Vida
- Plan 8 at Vida
- Plan 1 at Vida
- Plan 3 at Vida
- Plan 5 at Vida
- Plan 6 at Vida
- 1304 Barbet Cir Unit 6
- 1304 Barbet Cir Unit 1
- 532 Cashmere Ct
- 1303 Besra Terrace Unit 2
- 1303 Besra Terrace Unit 5
- 1303 Besra Terrace Unit 13
- 1192 Vanderbilt Ct E
- 1189 Vanderbilt Ct E
- 1170 Ribier Ct
- 1166 Ribier Ct
- 1196 Vanderbilt Ct E
- 1193 Vanderbilt Ct E
- 1193 Sesame Dr
- 1189 Sesame Dr
- 1165 Ribier Ct
- 1197 Vanderbilt Ct E
- 1181 Sesame Dr
- 1162 Ribier Ct
- 657 Vanderbilt Dr
- 1194 Vanderbilt Ct W
- 1175 Sesame Dr
- 1161 Ribier Ct
- 1164 Regia Ct
- 1190 Vanderbilt Ct W
- 1198 Vanderbilt Ct W Unit 4
- 1158 Ribier Ct