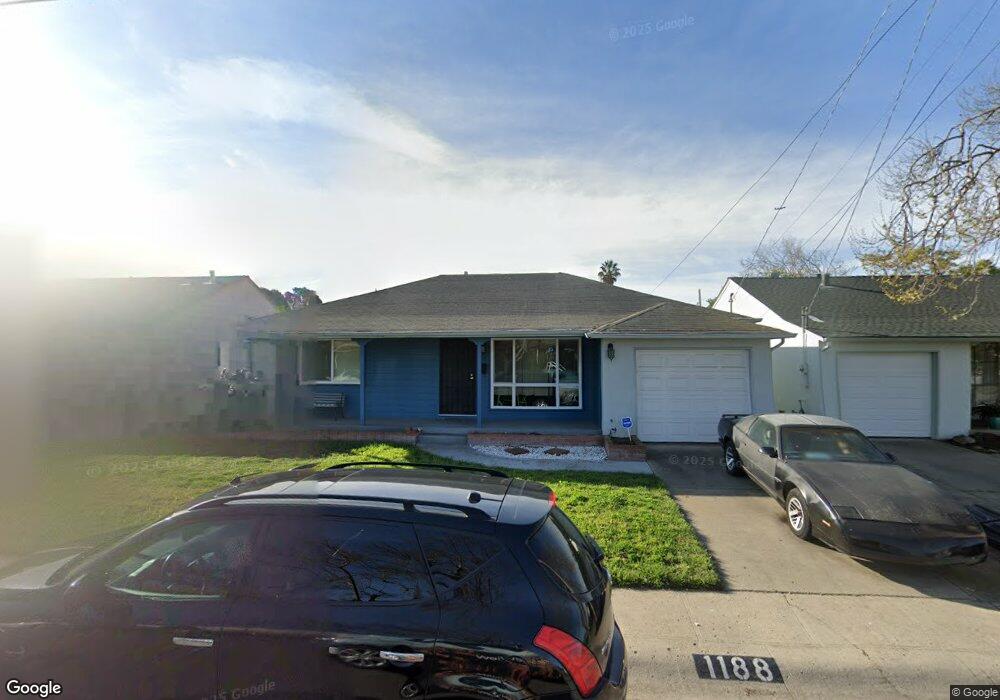
1188 Via Los Trancos San Lorenzo, CA 94580
Estimated Value: $829,000 - $871,000
3
Beds
2
Baths
1,383
Sq Ft
$613/Sq Ft
Est. Value
About This Home
This home is located at 1188 Via Los Trancos, San Lorenzo, CA 94580 and is currently estimated at $847,371, approximately $612 per square foot. 1188 Via Los Trancos is a home located in Alameda County with nearby schools including Del Rey Elementary School, Bohannon Middle School, and Arroyo High School.
Ownership History
Date
Name
Owned For
Owner Type
Purchase Details
Closed on
Oct 27, 2020
Sold by
Mclelland Kathryn B
Bought by
Brooks Daniel S
Current Estimated Value
Home Financials for this Owner
Home Financials are based on the most recent Mortgage that was taken out on this home.
Original Mortgage
$306,000
Outstanding Balance
$272,785
Interest Rate
2.9%
Mortgage Type
New Conventional
Estimated Equity
$574,586
Purchase Details
Closed on
Dec 8, 2014
Sold by
Medeiros Constance S and Estate Of Gwendolynn Barlow
Bought by
Brooks Daniel S
Home Financials for this Owner
Home Financials are based on the most recent Mortgage that was taken out on this home.
Original Mortgage
$335,950
Interest Rate
4%
Mortgage Type
New Conventional
Purchase Details
Closed on
Dec 9, 2010
Sold by
Kennedy Jerald R
Bought by
Kennedy Jerald R
Create a Home Valuation Report for This Property
The Home Valuation Report is an in-depth analysis detailing your home's value as well as a comparison with similar homes in the area
Home Values in the Area
Average Home Value in this Area
Purchase History
| Date | Buyer | Sale Price | Title Company |
|---|---|---|---|
| Brooks Daniel S | -- | Old Republic Title Company | |
| Brooks Daniel S | -- | Old Republic Title Company | |
| Brooks Daniel S | $420,000 | Chicago Title Company | |
| Kennedy Jerald R | -- | None Available |
Source: Public Records
Mortgage History
| Date | Status | Borrower | Loan Amount |
|---|---|---|---|
| Open | Brooks Daniel S | $306,000 | |
| Previous Owner | Brooks Daniel S | $335,950 |
Source: Public Records
Tax History Compared to Growth
Tax History
| Year | Tax Paid | Tax Assessment Tax Assessment Total Assessment is a certain percentage of the fair market value that is determined by local assessors to be the total taxable value of land and additions on the property. | Land | Improvement |
|---|---|---|---|---|
| 2025 | $6,671 | $504,760 | $151,428 | $353,332 |
| 2024 | $6,671 | $494,864 | $148,459 | $346,405 |
| 2023 | $6,641 | $485,162 | $145,548 | $339,614 |
| 2022 | $6,542 | $475,650 | $142,695 | $332,955 |
| 2021 | $6,363 | $466,325 | $139,897 | $326,428 |
| 2020 | $6,226 | $461,545 | $138,463 | $323,082 |
| 2019 | $6,235 | $452,498 | $135,749 | $316,749 |
| 2018 | $5,889 | $443,628 | $133,088 | $310,540 |
| 2017 | $5,622 | $434,930 | $130,479 | $304,451 |
| 2016 | $5,364 | $426,404 | $127,921 | $298,483 |
| 2015 | $5,248 | $420,000 | $126,000 | $294,000 |
| 2014 | $1,117 | $61,202 | $31,001 | $30,201 |
Source: Public Records
Map
Nearby Homes
- 18005 Sunol Rd
- 17354 Via el Cerrito
- 18003 Incline Place
- 1401 Via Coralla
- 18018 Sahara Rd
- 819 Bockman Rd
- 18251 Via Jose
- 17316 Via Flores
- 17347 Via Encinas
- 1311 Via Manzanas
- 17761 Via Arriba
- 1608 Keller Ave
- 1867 Via Buena Vista
- 19150 Hesperian Blvd Unit 19
- 1575 Via Lucas
- 769 Bartlett Ave
- 16050 Via Olinda
- 1766 Via Redondo
- 16011 Via Conejo
- 19665 Royal Ave
- 1180 Via Los Trancos
- 1194 Via Los Trancos
- 1176 Via Los Trancos
- 1202 Via Los Trancos
- 1215 Via Dolorosa
- 1221 Via Dolorosa
- 1205 Via Dolorosa
- 1197 Via Dolorosa
- 1229 Via Dolorosa
- 1170 Via Los Trancos
- 1208 Via Los Trancos
- 1187 Via Los Trancos
- 1193 Via Los Trancos
- 1179 Via Los Trancos
- 1189 Via Dolorosa
- 1237 Via Dolorosa
- 1175 Via Los Trancos
- 1201 Via Los Trancos
- 1164 Via Los Trancos
- 1214 Via Los Trancos