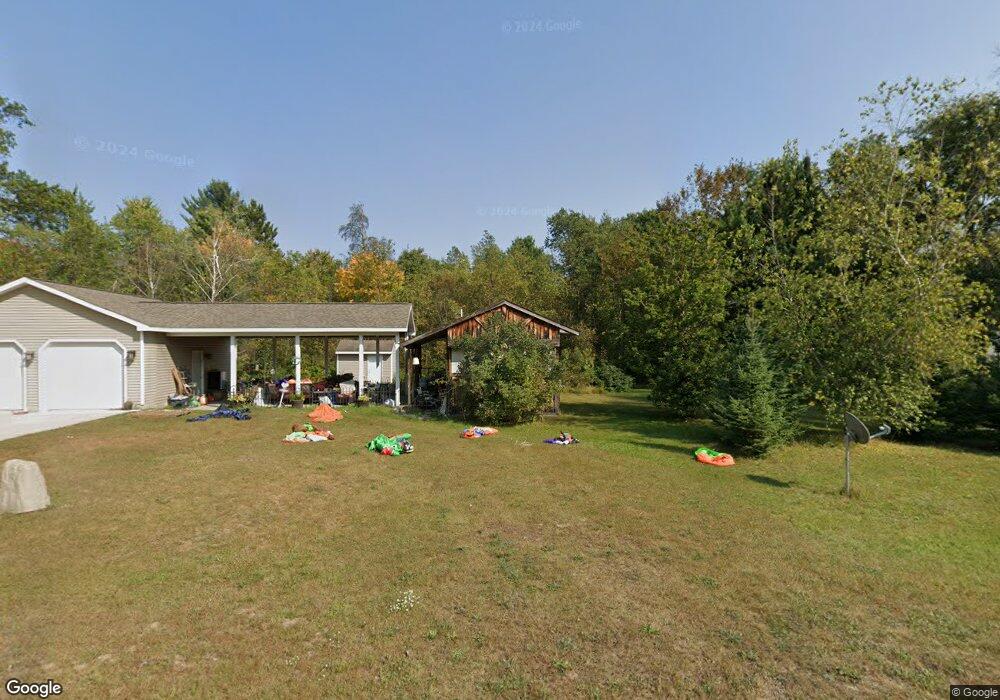
11883 E Roberta Dr Roscommon, MI 48653
Estimated Value: $71,360 - $119,000
Studio
1
Bath
854
Sq Ft
$121/Sq Ft
Est. Value
About This Home
This home is located at 11883 E Roberta Dr, Roscommon, MI 48653 and is currently estimated at $103,340, approximately $121 per square foot. 11883 E Roberta Dr is a home with nearby schools including Roscommon Elementary School, Roscommon Middle School, and Roscommon High School.
Ownership History
Date
Name
Owned For
Owner Type
Purchase Details
Closed on
Jun 10, 2025
Sold by
Raymond Michael T
Bought by
Raymond Michael T
Current Estimated Value
Purchase Details
Closed on
Sep 9, 2016
Sold by
Coulthard Alvira and Coulthard Joseph
Bought by
Raymond Michael T
Purchase Details
Closed on
Sep 18, 2007
Sold by
Raymond Thomas H
Bought by
Coulthard, Joseph, Trustee
Purchase Details
Closed on
Sep 7, 2004
Sold by
Dougherty David C and Dougherty Marlene K
Bought by
Raymond Thomas H and Raymond Vicke L
Purchase Details
Closed on
Aug 11, 2004
Sold by
Howe Robert L
Bought by
Dougherty David C and Dougherty Marlene K
Purchase Details
Closed on
Jan 30, 2002
Sold by
Howe Tammy S
Bought by
Howe Robert L
Purchase Details
Closed on
Jul 28, 1997
Sold by
Dougherty David and Dougherty Kay
Bought by
Howe Robert L and Howe Tammy S
Purchase Details
Closed on
May 6, 1997
Bought by
Dougherty David and Dougherty Kay
Purchase Details
Closed on
Oct 4, 1995
Create a Home Valuation Report for This Property
The Home Valuation Report is an in-depth analysis detailing your home's value as well as a comparison with similar homes in the area
Home Values in the Area
Average Home Value in this Area
Purchase History
| Date | Buyer | Sale Price | Title Company |
|---|---|---|---|
| Raymond Michael T | -- | -- | |
| Raymond Michael T | -- | None Available | |
| Coulthard, Joseph, Trustee | $21,000 | -- | |
| Raymond Thomas H | $15,500 | -- | |
| Dougherty David C | -- | -- | |
| Howe Robert L | -- | -- | |
| Howe Robert L | $27,900 | -- | |
| Dougherty David | $16,500 | -- | |
| -- | $14,800 | -- |
Source: Public Records
Tax History
| Year | Tax Paid | Tax Assessment Tax Assessment Total Assessment is a certain percentage of the fair market value that is determined by local assessors to be the total taxable value of land and additions on the property. | Land | Improvement |
|---|---|---|---|---|
| 2025 | $138 | $32,900 | $2,800 | $30,100 |
| 2024 | $135 | $31,900 | $2,800 | $29,100 |
| 2023 | $129 | $27,600 | $2,800 | $24,800 |
| 2022 | $123 | $22,500 | $2,800 | $19,700 |
| 2021 | $391 | $20,800 | $2,800 | $18,000 |
| 2020 | $363 | $20,300 | $2,800 | $17,500 |
| 2019 | $354 | $18,800 | $2,800 | $16,000 |
| 2018 | $557 | $16,500 | $2,800 | $13,700 |
| 2017 | $195 | $16,100 | $2,800 | $13,300 |
| 2016 | $110 | $10,400 | $2,800 | $7,600 |
| 2015 | -- | $10,400 | $0 | $0 |
| 2014 | -- | $10,300 | $0 | $0 |
| 2013 | -- | $9,100 | $0 | $0 |
Source: Public Records
Map
Nearby Homes
- LOT #42 E Roberta Dr
- Lots 26-27 W Roberta Dr
- 2948 E Michigan Hwy
- 11491 Pines Trail
- 11875 Hoetzel Rd
- 38 S Eugene Dr
- Parcel 13 N M-18
- Parcel 14 N M-18
- 11282 Steckert Bridge Rd
- 4801 Livingstone Rd
- 206 N Main St
- 0 N Main St Unit 20251028047
- 11269 Tanglewood Dr
- 11536 N Central Dr
- 1941 High Rd
- 0VL Chase Bridge Rd
- 111 Anna Ave
- 0 Beaver Creek Trail Unit 26373219
- Silverbow Ln
- Silverbow Ln
- 11847 E Roberta Dr
- 11874 E Roberta Dr
- Lot 42 E Roberta Dr
- XXX E Roberta Dr
- 11793 E Roberta Dr
- 2819 N M 18
- LOT 18 Roberta Dr
- LOT 18 Roberta Dr Unit Lot 18
- 39 E Roberta Dr
- 11955 E Roberta Dr
- 11805 W Roberta Dr
- Lot 26 W Roberta Dr
- Lot 27 W Roberta Dr
- Lot 21 W Roberta Dr
- 11767 E Roberta Dr
- xx Roberta
- XXX W Roberta Dr
- 11919 E Roberta Dr
- 2719 N Roberta Dr
- 11878 W Roberta Dr
Your Personal Tour Guide
Ask me questions while you tour the home.