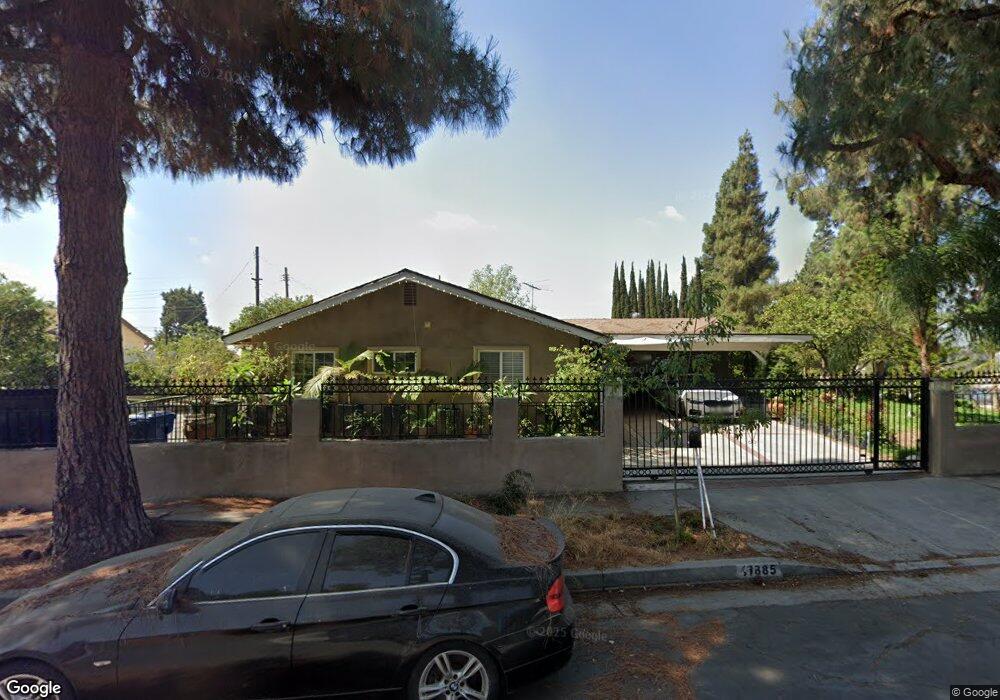
11885 Vanport Ave Sylmar, CA 91342
Estimated Value: $825,000 - $928,000
5
Beds
2
Baths
1,771
Sq Ft
$487/Sq Ft
Est. Value
About This Home
This home is located at 11885 Vanport Ave, Sylmar, CA 91342 and is currently estimated at $862,557, approximately $487 per square foot. 11885 Vanport Ave is a home located in Los Angeles County with nearby schools including Charles Maclay Middle School, San Fernando Senior High School, and Fenton Primary Center.
Ownership History
Date
Name
Owned For
Owner Type
Purchase Details
Closed on
Oct 31, 2024
Sold by
Terrazas Deloyola Maria Elena and Terrazas Efrain Loyola
Bought by
Loyola Elena and Loyola Maria Elena
Current Estimated Value
Purchase Details
Closed on
Jun 16, 2017
Sold by
Loyola Efrain and De Loyola Maria Elena Terrazas
Bought by
Loyola Efrain and Loyola Elena
Home Financials for this Owner
Home Financials are based on the most recent Mortgage that was taken out on this home.
Original Mortgage
$200,000
Interest Rate
4.05%
Mortgage Type
New Conventional
Purchase Details
Closed on
Oct 5, 1999
Sold by
Muniz Jessie Z and Muniz Gloria
Bought by
Loyola Efrain and Loyola Elena
Home Financials for this Owner
Home Financials are based on the most recent Mortgage that was taken out on this home.
Original Mortgage
$138,970
Interest Rate
7.82%
Mortgage Type
FHA
Create a Home Valuation Report for This Property
The Home Valuation Report is an in-depth analysis detailing your home's value as well as a comparison with similar homes in the area
Home Values in the Area
Average Home Value in this Area
Purchase History
| Date | Buyer | Sale Price | Title Company |
|---|---|---|---|
| Loyola Elena | -- | None Listed On Document | |
| Loyola Elena | -- | None Listed On Document | |
| Loyola Efrain | -- | Fidelity National Title Co | |
| Loyola Efrain | $140,000 | -- |
Source: Public Records
Mortgage History
| Date | Status | Borrower | Loan Amount |
|---|---|---|---|
| Previous Owner | Loyola Efrain | $200,000 | |
| Previous Owner | Loyola Efrain | $138,970 |
Source: Public Records
Tax History Compared to Growth
Tax History
| Year | Tax Paid | Tax Assessment Tax Assessment Total Assessment is a certain percentage of the fair market value that is determined by local assessors to be the total taxable value of land and additions on the property. | Land | Improvement |
|---|---|---|---|---|
| 2025 | $3,243 | $242,053 | $132,624 | $109,429 |
| 2024 | $3,243 | $237,308 | $130,024 | $107,284 |
| 2023 | $3,186 | $232,656 | $127,475 | $105,181 |
| 2022 | $3,048 | $228,095 | $124,976 | $103,119 |
| 2021 | $3,004 | $223,624 | $122,526 | $101,098 |
| 2019 | $2,921 | $216,993 | $118,893 | $98,100 |
| 2018 | $2,809 | $212,739 | $116,562 | $96,177 |
| 2016 | $2,672 | $204,481 | $112,037 | $92,444 |
| 2015 | $2,635 | $201,411 | $110,355 | $91,056 |
| 2014 | $2,653 | $197,467 | $108,194 | $89,273 |
Source: Public Records
Map
Nearby Homes
- 11863 Vanport Ave
- 12401 Filmore St Unit 212
- 12401 Filmore St
- 12036 Jouett St
- 11926 Kathyann St
- 12331 Carl St
- 12339 Carl St
- 11870 Jouett St
- 11849 Kathyann St
- 11529 Hunnewell Ave
- 11465 Fox Hollow Ln
- 12229 Inspire Ln
- 12423 Sonoma Dr Unit 8
- 11384 Dronfield Terrace Unit 36
- 12001 Foothill Blvd Unit 56
- 11779 Dronfield Ave
- 12601 Van Nuys Blvd Unit 256
- 12601 Van Nuys Blvd Unit 222
- 12601 Van Nuys Blvd Unit 138
- 12601 Van Nuys Blvd Unit 220
- 12268 Judd St
- 11877 Vanport Ave
- 12274 Judd St
- 11871 Vanport Ave
- 12261 Mercer St
- 11894 Vanport Ave
- 11901 Vanport Ave
- 11878 Vanport Ave
- 12260 Mercer St
- 11872 Vanport Ave
- 12280 Judd St
- 12277 Judd St
- 12267 Mercer St
- 11866 Vanport Ave
- 11895 Wheeler Ave
- 11889 Wheeler Ave
- 12264 Mercer St
- 12300 Judd St
- 11857 Vanport Ave
- 11885 Wheeler Ave