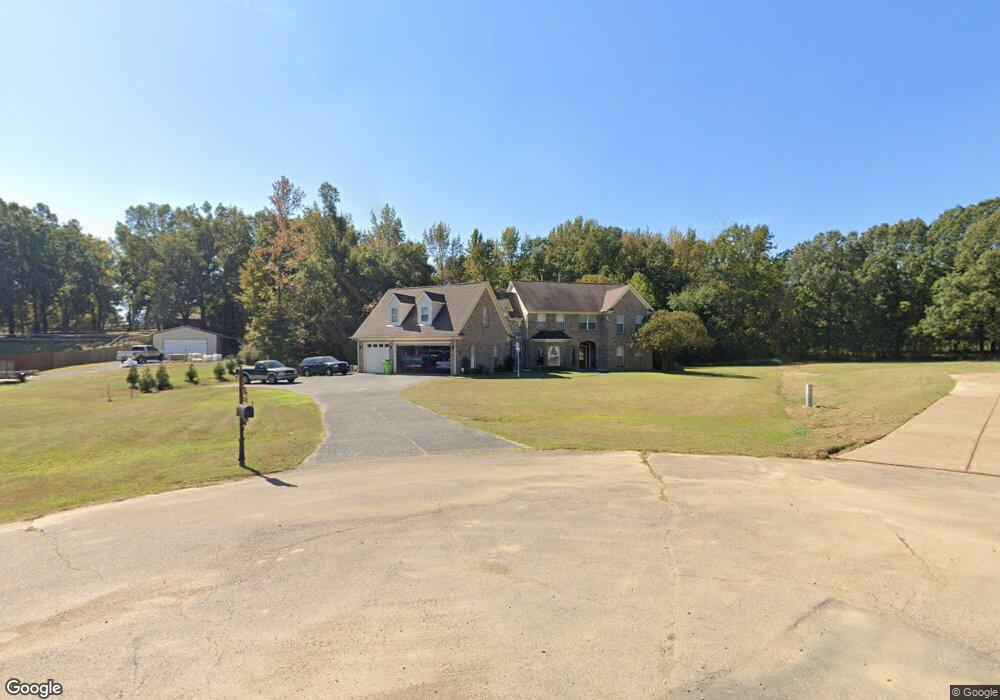
11889 Brom Cove Arlington, TN 38002
Estimated Value: $564,000 - $654,000
4
Beds
4
Baths
4,586
Sq Ft
$132/Sq Ft
Est. Value
About This Home
This home is located at 11889 Brom Cove, Arlington, TN 38002 and is currently estimated at $605,717, approximately $132 per square foot. 11889 Brom Cove is a home located in Shelby County with nearby schools including Barrets Elementary School and Bolton High School.
Ownership History
Date
Name
Owned For
Owner Type
Purchase Details
Closed on
Apr 15, 2009
Sold by
Island Source Ii Llc
Bought by
Pederson James R and Pederson Diane
Current Estimated Value
Home Financials for this Owner
Home Financials are based on the most recent Mortgage that was taken out on this home.
Original Mortgage
$286,864
Interest Rate
4.8%
Mortgage Type
VA
Purchase Details
Closed on
Dec 19, 2008
Sold by
Regions Bank
Bought by
Island Source Ii Llc
Purchase Details
Closed on
Jan 30, 2008
Sold by
Wilson Kenneth C and Wilson Tammy R
Bought by
Regions Bank
Purchase Details
Closed on
Aug 13, 2001
Sold by
Liles James A and Liles Carla J
Bought by
Wilson Kenneth C and Wilson Tammy R
Home Financials for this Owner
Home Financials are based on the most recent Mortgage that was taken out on this home.
Original Mortgage
$38,000
Interest Rate
7.18%
Create a Home Valuation Report for This Property
The Home Valuation Report is an in-depth analysis detailing your home's value as well as a comparison with similar homes in the area
Home Values in the Area
Average Home Value in this Area
Purchase History
| Date | Buyer | Sale Price | Title Company |
|---|---|---|---|
| Pederson James R | $277,700 | None Available | |
| Island Source Ii Llc | $148,500 | None Available | |
| Regions Bank | $109,376 | None Available | |
| Wilson Kenneth C | $39,000 | Mid America Title Agency Inc |
Source: Public Records
Mortgage History
| Date | Status | Borrower | Loan Amount |
|---|---|---|---|
| Previous Owner | Pederson James R | $286,864 | |
| Previous Owner | Wilson Kenneth C | $38,000 |
Source: Public Records
Tax History Compared to Growth
Tax History
| Year | Tax Paid | Tax Assessment Tax Assessment Total Assessment is a certain percentage of the fair market value that is determined by local assessors to be the total taxable value of land and additions on the property. | Land | Improvement |
|---|---|---|---|---|
| 2025 | $3,302 | $138,925 | $24,275 | $114,650 |
| 2024 | $3,302 | $97,400 | $19,050 | $78,350 |
| 2023 | $3,302 | $97,400 | $19,050 | $78,350 |
| 2022 | $3,302 | $97,400 | $19,050 | $78,350 |
| 2021 | $3,360 | $97,400 | $19,050 | $78,350 |
| 2020 | $3,379 | $83,425 | $14,950 | $68,475 |
| 2019 | $3,379 | $83,425 | $14,950 | $68,475 |
| 2018 | $3,379 | $83,425 | $14,950 | $68,475 |
| 2017 | $3,429 | $83,425 | $14,950 | $68,475 |
| 2016 | $3,320 | $75,975 | $0 | $0 |
| 2014 | $3,320 | $75,975 | $0 | $0 |
Source: Public Records
Map
Nearby Homes
- 9408 Osborntown Rd
- 0 Osborntown Rd Unit 10208347
- 0 Osborntown Rd Unit 10203897
- 11641 Turley Ln
- 0 Moose Rd Unit 10208328
- 165 Gilliam Ln
- 914 Beaver Creek Rd
- 29 Planters Grove Trail
- 62 Planters Grove Trail
- 11280 Pleasant Ridge Rd
- 10143 Mount Carmel Rd
- 8783 Deadfall Rd
- 0 Willow Oak Dr
- 10941 Lubov Rd
- 9958 9958 Idaville Dr
- 7771 Hwy 14 Hwy S
- 7767 Hwy 14 Hwy S
- 828 Lyndsey Dr
- 0 Gainsville Rd
- 1215 Beaver Creek Rd
- 11881 Brom Cove
- 11907 Brom Cove
- 11884 Brom Cove
- 11900 Brom Cove
- 11925 Brom Cove
- 11920 Brom Cove
- 11861 Osborn Valley Ln
- 11891 Osborn Valley Ln
- 11915 Osborn Valley Ln
- 11835 Osborn Valley Ln
- 8858 Collierville Arlington Rd
- 8815 Collierville Arlington Rd
- 8825 Collierville Arlington Rd
- 11846 Osborn Valley Ln
- 11890 Osborn Valley Ln
- 11819 Osborn Valley Ln
- 8820 Collierville Arlington Rd
- 9022 Damont Cove
- 11795 Osborn Valley Ln
- 9015 Damont Cove