1189 E 1650 S Bountiful, UT 84010
Estimated Value: $1,244,000 - $1,877,376
5
Beds
4
Baths
4,138
Sq Ft
$395/Sq Ft
Est. Value
About This Home
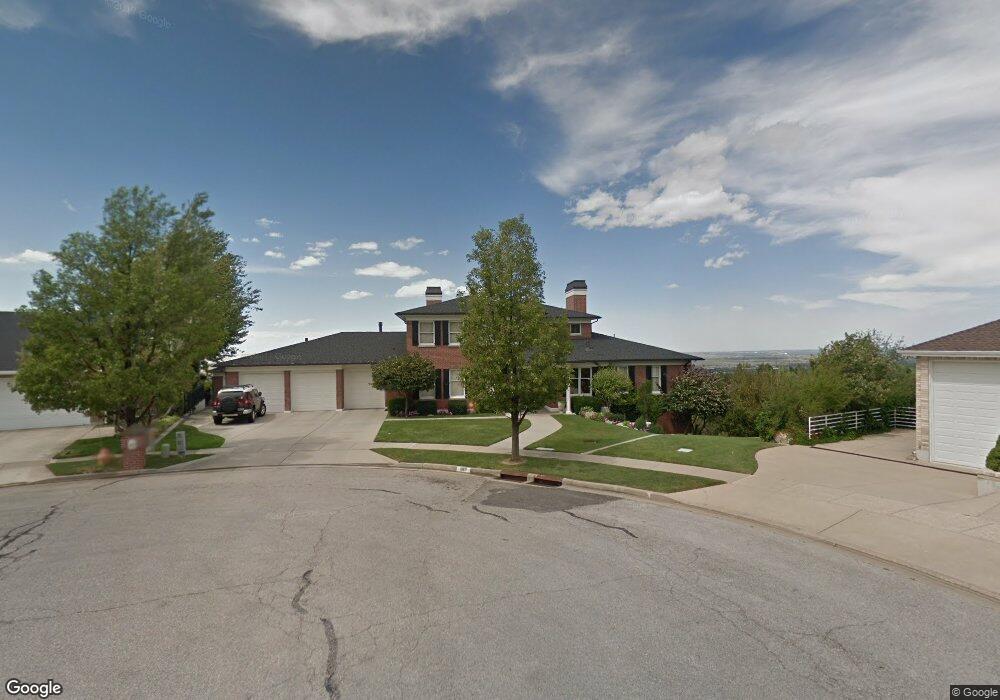
This home is located at 1189 E 1650 S, Bountiful, UT 84010 and is currently estimated at $1,633,792, approximately $394 per square foot. 1189 E 1650 S is a home located in Davis County with nearby schools including Valley View School, Mueller Park Junior High School, and Bountiful High School.
Ownership History
Date
Name
Owned For
Owner Type
Purchase Details
Closed on
Mar 13, 2014
Sold by
Canyon Oaks Holding Llc
Bought by
Leishman Kristine and The Kristine Leishman Trust
Current Estimated Value
Purchase Details
Closed on
Mar 18, 2011
Sold by
Leishman L Scott and Leishman Kristine
Bought by
Canyon Oaks Holdings L L C
Home Financials for this Owner
Home Financials are based on the most recent Mortgage that was taken out on this home.
Original Mortgage
$232,000
Interest Rate
5.02%
Mortgage Type
New Conventional
Purchase Details
Closed on
Oct 2, 2007
Sold by
Leishman L Scott and Leishman Kristine
Bought by
Canyon Oaks Holding Llc
Create a Home Valuation Report for This Property
The Home Valuation Report is an in-depth analysis detailing your home's value as well as a comparison with similar homes in the area
Purchase History
| Date | Buyer | Sale Price | Title Company |
|---|---|---|---|
| Leishman Kristine | -- | None Available | |
| Canyon Oaks Holdings L L C | -- | Aspen Title Insurance Agency | |
| Leishman L Scott | -- | Aspen Title Insurance Agenc | |
| Canyon Oaks Holding Llc | -- | None Available |
Source: Public Records
Mortgage History
| Date | Status | Borrower | Loan Amount |
|---|---|---|---|
| Previous Owner | Leishman L Scott | $232,000 |
Source: Public Records
Tax History
| Year | Tax Paid | Tax Assessment Tax Assessment Total Assessment is a certain percentage of the fair market value that is determined by local assessors to be the total taxable value of land and additions on the property. | Land | Improvement |
|---|---|---|---|---|
| 2025 | $11,209 | $1,008,014 | $337,049 | $670,965 |
| 2024 | $11,005 | $1,017,753 | $320,968 | $696,785 |
| 2023 | $9,940 | $1,640,000 | $613,447 | $1,026,553 |
| 2022 | $9,510 | $856,900 | $333,476 | $523,424 |
| 2021 | $7,222 | $982,000 | $501,170 | $480,830 |
| 2020 | $6,710 | $918,000 | $430,960 | $487,040 |
| 2019 | $6,724 | $899,000 | $332,772 | $566,228 |
| 2018 | $6,323 | $830,000 | $321,853 | $508,147 |
| 2016 | $6,067 | $441,572 | $114,265 | $327,307 |
| 2015 | $6,197 | $427,437 | $114,265 | $313,172 |
| 2014 | $5,318 | $372,811 | $114,265 | $258,546 |
| 2013 | -- | $322,158 | $124,755 | $197,403 |
Source: Public Records
Map
Nearby Homes
- 1087 Arlington Way
- 1888 S 1150 E
- 1785 1450 E
- 994 Deborah Dr
- 775 E 1500 S
- 1596 E Millbrook Way
- 1735 S Temple Ct Unit 203
- 795 Abby Ln Unit 5
- 2115 S Ridgewood Way
- 861 E Millbrook Way
- 1987 Mapleview Dr
- 1761 S Davis Blvd
- 2136 S 900 E
- 631 E 1700 S
- 831 E San Simeon Way S
- 761 San Simeon Way
- 1742 E Ridge Point Dr
- 1886 S Jeri Dr
- 0 Bountiful Blvd
- 1878 E Ridge Point Dr
Your Personal Tour Guide
Ask me questions while you tour the home.