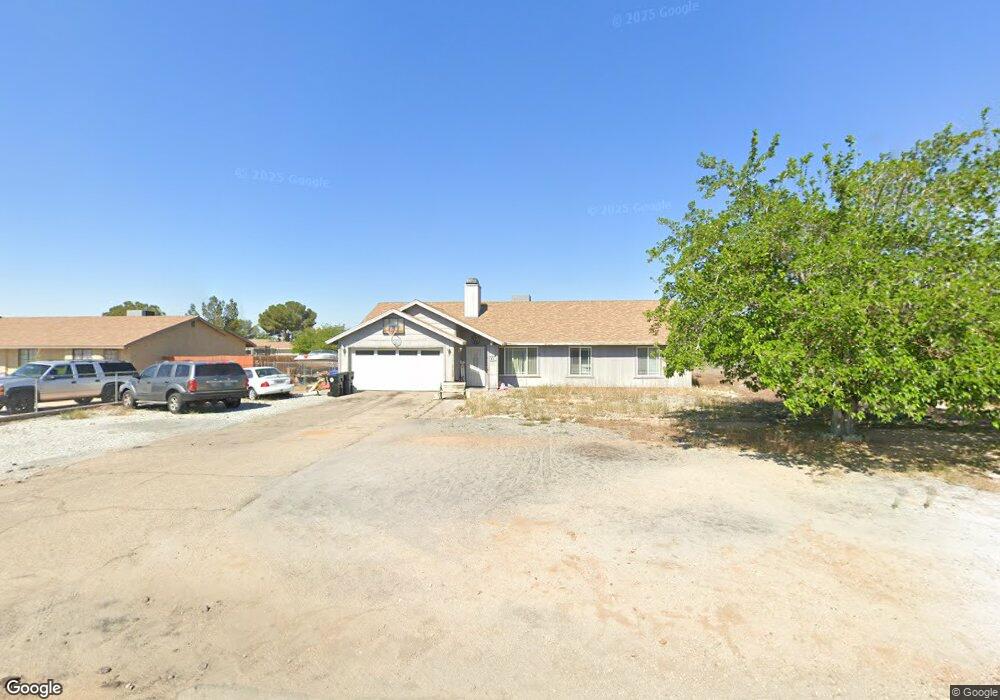
11890 Pasco Rd Apple Valley, CA 92308
High Desert NeighborhoodEstimated Value: $331,000 - $407,000
4
Beds
2
Baths
1,416
Sq Ft
$265/Sq Ft
Est. Value
About This Home
This home is located at 11890 Pasco Rd, Apple Valley, CA 92308 and is currently estimated at $374,650, approximately $264 per square foot. 11890 Pasco Rd is a home located in San Bernardino County with nearby schools including Sandia Elementary School and Apple Valley High School.
Ownership History
Date
Name
Owned For
Owner Type
Purchase Details
Closed on
Feb 27, 2001
Sold by
Federal National Mortgage Association
Bought by
Donahue Joseph and Donahue Donna R
Current Estimated Value
Home Financials for this Owner
Home Financials are based on the most recent Mortgage that was taken out on this home.
Original Mortgage
$91,680
Outstanding Balance
$33,633
Interest Rate
7.12%
Mortgage Type
FHA
Estimated Equity
$341,017
Purchase Details
Closed on
Jun 1, 2000
Sold by
Dempsey Thomas E
Bought by
Federal National Mortgage Association
Purchase Details
Closed on
Dec 27, 1993
Sold by
Dempsey Thomas E and Dempsey Celia M
Bought by
Dempsey Thomas E and Dempsey Celia M
Home Financials for this Owner
Home Financials are based on the most recent Mortgage that was taken out on this home.
Original Mortgage
$63,137
Interest Rate
7.09%
Mortgage Type
FHA
Create a Home Valuation Report for This Property
The Home Valuation Report is an in-depth analysis detailing your home's value as well as a comparison with similar homes in the area
Home Values in the Area
Average Home Value in this Area
Purchase History
We collect this data history from publicly available records. To have your information removed, we recommend requesting removal directly through your county’s website.
| Date | Buyer | Sale Price | Title Company |
|---|---|---|---|
| Donahue Joseph | $92,500 | Chicago Title Co | |
| Federal National Mortgage Association | $68,218 | Fidelity Title | |
| Dempsey Thomas E | -- | Stewart Title Co |
Source: Public Records
Mortgage History
We collect this data history from publicly available records. To have your information removed, we recommend requesting removal directly through your county’s website.
| Date | Status | Borrower | Loan Amount |
|---|---|---|---|
| Open | Donahue Joseph | $91,680 | |
| Previous Owner | Dempsey Thomas E | $63,137 |
Source: Public Records
Tax History
| Year | Tax Paid | Tax Assessment Tax Assessment Total Assessment is a certain percentage of the fair market value that is determined by local assessors to be the total taxable value of land and additions on the property. | Land | Improvement |
|---|---|---|---|---|
| 2025 | $1,711 | $139,385 | $23,694 | $115,691 |
| 2024 | $1,904 | $136,652 | $23,229 | $113,423 |
| 2023 | $1,647 | $133,973 | $22,774 | $111,199 |
| 2022 | $1,622 | $131,346 | $22,327 | $109,019 |
| 2021 | $1,585 | $128,770 | $21,889 | $106,881 |
| 2020 | $1,566 | $127,450 | $21,665 | $105,785 |
| 2019 | $1,537 | $124,951 | $21,240 | $103,711 |
| 2018 | $1,499 | $122,501 | $20,824 | $101,677 |
| 2017 | $1,478 | $120,099 | $20,416 | $99,683 |
| 2016 | $1,395 | $117,744 | $20,016 | $97,728 |
| 2015 | -- | $115,975 | $19,715 | $96,260 |
| 2014 | $1,356 | $113,703 | $19,329 | $94,374 |
Source: Public Records
Map
Nearby Homes
- 11935 Wapato Rd
- 11852 Jamacha Rd
- 21650 Bear Valley Rd
- 21621 Sandia Rd Unit 31
- 21621 Sandia Rd Unit 128
- 21621 Sandia Rd Unit 150
- 21621 Sandia Rd Unit 138
- 21621 Sandia Rd Unit 131
- 11988 Pecos Rd
- 0 Saratoga Rd
- 11911 Kiowa Rd
- 11427 Cibola Rd
- 21110 Multnomah Rd
- 12365 Waynoka Rd
- 11331 Pasco Rd
- 11 Navajo Rd
- 12348 Omak Rd
- 0 Sandia Rd Unit HD26025135
- 21495 Minodoka Rd
- 11545 Kiowa Rd
- 11906 Pasco Rd
- 11882 Pasco Rd
- 11891 Wapato Rd
- 11928 Pasco Rd
- 11868 Pasco Rd
- 11905 Wapato Rd
- 11877 Wapato Rd
- 11893 Pasco Rd
- 11921 Wapato Rd
- 11861 Wapato Rd
- 11869 Pasco Rd
- 11915 Pasco Rd
- 11936 Pasco Rd Unit 3
- 11850 Pasco Rd
- 11855 Pasco Rd
- 11927 Pasco Rd
- 11851 Wapato Rd
- 11966 Pasco Rd
- 11834 Pasco Rd
- 11845 Pasco Rd
Your Personal Tour Guide
Ask me questions while you tour the home.