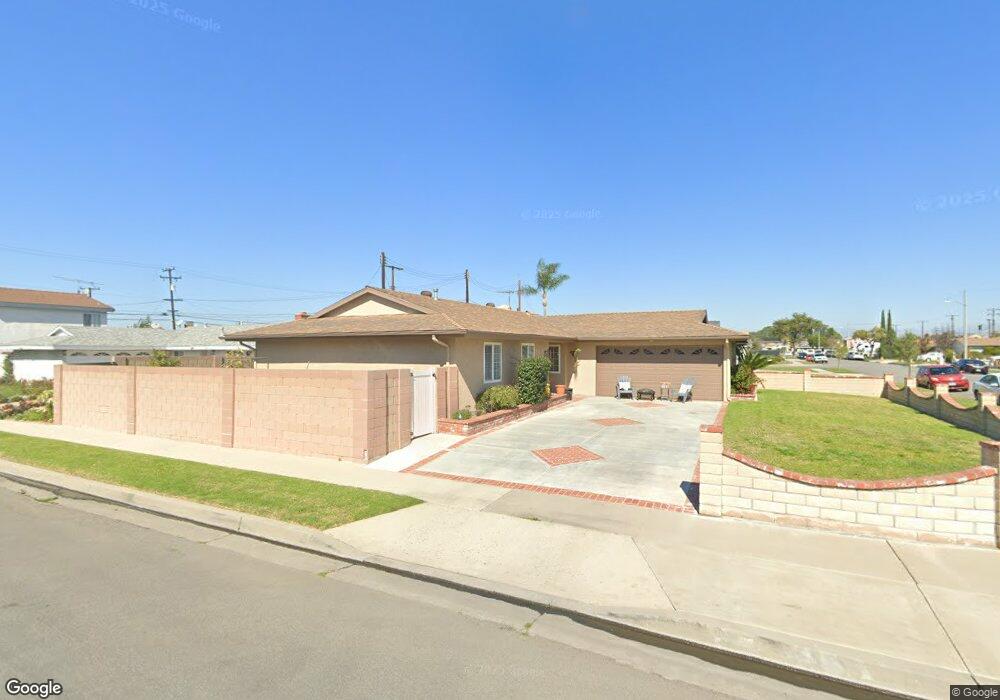
11891 Wutzke St Garden Grove, CA 92845
West Garden Grove NeighborhoodEstimated Value: $1,051,000 - $1,100,000
3
Beds
2
Baths
1,293
Sq Ft
$828/Sq Ft
Est. Value
About This Home
This home is located at 11891 Wutzke St, Garden Grove, CA 92845 and is currently estimated at $1,071,045, approximately $828 per square foot. 11891 Wutzke St is a home located in Orange County with nearby schools including Patton Elementary School, Hilton D. Bell Intermediate School, and Pacifica High School.
Ownership History
Date
Name
Owned For
Owner Type
Purchase Details
Closed on
Feb 6, 2023
Sold by
Johnson Family Trust
Bought by
Johnson Mark Dale and Johnson Kari L
Current Estimated Value
Home Financials for this Owner
Home Financials are based on the most recent Mortgage that was taken out on this home.
Original Mortgage
$583,600
Outstanding Balance
$564,481
Interest Rate
6.09%
Mortgage Type
New Conventional
Estimated Equity
$506,564
Purchase Details
Closed on
Jan 13, 2023
Sold by
Johnson Mark Dale
Bought by
Johnson Family Trust
Home Financials for this Owner
Home Financials are based on the most recent Mortgage that was taken out on this home.
Original Mortgage
$583,600
Outstanding Balance
$564,481
Interest Rate
6.09%
Mortgage Type
New Conventional
Estimated Equity
$506,564
Purchase Details
Closed on
Nov 22, 2022
Sold by
Johnson Family Trust
Bought by
Johnson Mark Dale
Purchase Details
Closed on
Oct 19, 2022
Sold by
Johnson Family Trust
Bought by
Johnson Mark Dale
Purchase Details
Closed on
Feb 11, 2014
Sold by
Johnson Lavell K and Johnson Darleen
Bought by
The Johnson Family Trust
Create a Home Valuation Report for This Property
The Home Valuation Report is an in-depth analysis detailing your home's value as well as a comparison with similar homes in the area
Home Values in the Area
Average Home Value in this Area
Purchase History
| Date | Buyer | Sale Price | Title Company |
|---|---|---|---|
| Johnson Mark Dale | $856,000 | Fidelity National Title | |
| Johnson Family Trust | -- | -- | |
| Johnson Mark Dale | -- | -- | |
| Johnson Mark Dale | -- | -- | |
| The Johnson Family Trust | -- | None Available |
Source: Public Records
Mortgage History
| Date | Status | Borrower | Loan Amount |
|---|---|---|---|
| Open | Johnson Mark Dale | $583,600 |
Source: Public Records
Tax History Compared to Growth
Tax History
| Year | Tax Paid | Tax Assessment Tax Assessment Total Assessment is a certain percentage of the fair market value that is determined by local assessors to be the total taxable value of land and additions on the property. | Land | Improvement |
|---|---|---|---|---|
| 2025 | $7,811 | $622,640 | $537,223 | $85,417 |
| 2024 | $7,811 | $610,432 | $526,689 | $83,743 |
| 2023 | $1,641 | $83,392 | $29,421 | $53,971 |
| 2022 | $1,598 | $81,757 | $28,844 | $52,913 |
| 2021 | $1,577 | $80,154 | $28,278 | $51,876 |
| 2020 | $1,559 | $79,333 | $27,988 | $51,345 |
| 2019 | $1,494 | $77,778 | $27,439 | $50,339 |
| 2018 | $1,465 | $76,253 | $26,901 | $49,352 |
| 2017 | $1,439 | $74,758 | $26,373 | $48,385 |
| 2016 | $1,386 | $73,293 | $25,856 | $47,437 |
| 2015 | $1,364 | $72,193 | $25,468 | $46,725 |
| 2014 | $1,328 | $70,779 | $24,969 | $45,810 |
Source: Public Records
Map
Nearby Homes
- 6631 Chapman Ave
- 11781 Lamplighter St
- 6801 Chapman Ave
- 12202 Wutzke St
- 6212 Santa Rita Ave
- 11580 Panay St
- 6861 Reefton Ave
- 11474 Shippigan Way
- 6906 Molokai Dr
- 6056 Palau St
- 11390 Nantucket Ct
- 6414 Anguilla Ave
- 6837 Amelia Way
- 5902 Belgrave Ave
- 6925 Brightwood Ln Unit 108
- 6971 Knollcrest Ln Unit 47
- 5832 Ludlow Ave
- 11901 Saint Mark St
- 6949 Danvers Dr
- 6884 Almondine Dr
- 11881 Wutzke St
- 6511 Santa Rita Ave
- 11911 Wutzke St
- 11871 Wutzke St
- 6512 Santa Monica Ave
- 6501 Santa Rita Ave
- 11912 Springdale St
- 11892 Wutzke St
- 11902 Wutzke St
- 11882 Wutzke St
- 11912 Wutzke St
- 6502 Santa Monica Ave
- 11922 Springdale St
- 11872 Wutzke St
- 11931 Wutzke St
- 11891 Carlotta St
- 11841 Wutzke St
- 11901 Carlotta St
- 11852 Wutzke St
- 6562 Santa Rita Ave