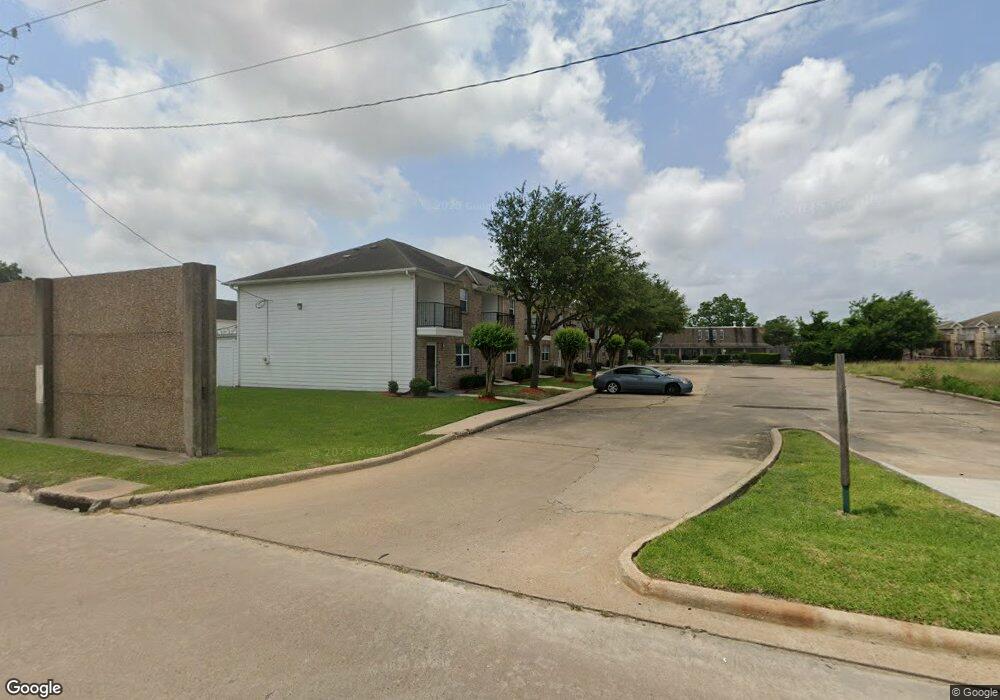
11899 Algonquin Dr Unit 11 Houston, TX 77089
Southbelt-Ellington NeighborhoodEstimated Value: $166,000 - $190,000
3
Beds
3
Baths
1,533
Sq Ft
$118/Sq Ft
Est. Value
About This Home
This home is located at 11899 Algonquin Dr Unit 11, Houston, TX 77089 and is currently estimated at $181,418, approximately $118 per square foot. 11899 Algonquin Dr Unit 11 is a home located in Harris County with nearby schools including Burnett Elementary School, Thompson Intermediate School, and Fred Roberts Middle School.
Ownership History
Date
Name
Owned For
Owner Type
Purchase Details
Closed on
May 25, 2018
Sold by
Nguyen Myly
Bought by
Negrete Maria Isabel
Current Estimated Value
Home Financials for this Owner
Home Financials are based on the most recent Mortgage that was taken out on this home.
Original Mortgage
$117,335
Outstanding Balance
$102,647
Interest Rate
5.12%
Mortgage Type
FHA
Estimated Equity
$78,771
Purchase Details
Closed on
May 13, 2010
Sold by
The Bank Of New York Mellon Trust Compan
Bought by
Nguyen Myly
Purchase Details
Closed on
Nov 3, 2009
Sold by
Zimmerman Lisa
Bought by
The Bank Of New York Mellon Trust Compan and The Bank Of New York Trust Company Na
Purchase Details
Closed on
Jul 5, 2005
Sold by
Atkinson Construction Inc
Bought by
Zimmerman Lisa
Home Financials for this Owner
Home Financials are based on the most recent Mortgage that was taken out on this home.
Original Mortgage
$88,800
Interest Rate
7.9%
Mortgage Type
Fannie Mae Freddie Mac
Create a Home Valuation Report for This Property
The Home Valuation Report is an in-depth analysis detailing your home's value as well as a comparison with similar homes in the area
Home Values in the Area
Average Home Value in this Area
Purchase History
| Date | Buyer | Sale Price | Title Company |
|---|---|---|---|
| Negrete Maria Isabel | -- | None Available | |
| Nguyen Myly | -- | Lsi Title Agency Inc | |
| The Bank Of New York Mellon Trust Compan | $77,017 | None Available | |
| Zimmerman Lisa | -- | Stewart Title Houston Div |
Source: Public Records
Mortgage History
| Date | Status | Borrower | Loan Amount |
|---|---|---|---|
| Open | Negrete Maria Isabel | $117,335 | |
| Previous Owner | Zimmerman Lisa | $88,800 | |
| Closed | Zimmerman Lisa | $10,000 |
Source: Public Records
Tax History Compared to Growth
Tax History
| Year | Tax Paid | Tax Assessment Tax Assessment Total Assessment is a certain percentage of the fair market value that is determined by local assessors to be the total taxable value of land and additions on the property. | Land | Improvement |
|---|---|---|---|---|
| 2025 | $2,339 | $173,006 | $31,070 | $141,936 |
| 2024 | $2,339 | $165,608 | $31,070 | $134,538 |
| 2023 | $2,339 | $165,608 | $31,070 | $134,538 |
| 2022 | $3,841 | $163,683 | $31,070 | $132,613 |
| 2021 | $3,664 | $145,857 | $30,138 | $115,719 |
| 2020 | $3,399 | $123,984 | $23,432 | $100,552 |
| 2019 | $3,318 | $115,089 | $13,694 | $101,395 |
| 2018 | $1,233 | $87,875 | $14,725 | $73,150 |
| 2017 | $3,182 | $115,555 | $14,725 | $100,830 |
| 2016 | $2,920 | $106,019 | $14,725 | $91,294 |
| 2015 | $2,380 | $96,688 | $8,835 | $87,853 |
| 2014 | $2,380 | $84,911 | $6,258 | $78,653 |
Source: Public Records
Map
Nearby Homes
- 11887 Algonquin Dr
- 11883 Algonquin Dr
- 11881 Algonquin Dr
- 11879 Algonquin Dr
- 11877 Algonquin Dr
- 11847 Algonquin Dr
- 12830 Gotham Dr
- 11907 Fairbury Dr
- 12743 Corning Dr
- 12010 Flushing Meadows Dr
- 12702 Gotham Dr
- 11703 Teaneck Dr
- 12510 Corning Dr
- 12515 Gotham Dr
- 12122 Fairbury Dr
- 10914 Kelly Hill Ct
- 11426 Meadow Joy Dr
- 11603 Graywood Dr
- 12314 Flushing Meadows Dr
- 11803 Rhinebeck Dr
- 11899 Algonquin Dr Unit 7
- 11899 Algonquin Dr Unit 8
- 11899 Algonquin Dr Unit 4
- 11899 Algonquin Dr Unit 12
- 11899 Algonquin Dr Unit 10
- 11899 Algonquin Dr Unit 14
- 11899 Algonquin Dr Unit 13
- 11899 Algonquin Dr Unit 9
- 11899 Algonquin Dr Unit 6
- 11899 Algonquin Dr Unit 5
- 11899 Algonquin Dr Unit 3
- 11899 Algonquin Dr Unit 2
- 11899 Algonquin Dr Unit 1
- 11899 Algonquin Dr Unit 13
- 11899 Algonquin Dr
- 11899 Algonquin Dr
- 11899 Algonquin Dr
- 11518 Gulf Fwy
- 11520 Gulf Fwy
- 11524 Gulf Fwy