119 2nd St Glendive, MT 59330
Estimated Value: $137,000 - $182,177
3
Beds
1
Bath
1,104
Sq Ft
$146/Sq Ft
Est. Value
About This Home
This home is located at 119 2nd St, Glendive, MT 59330 and is currently estimated at $161,294, approximately $146 per square foot. 119 2nd St is a home located in Dawson County with nearby schools including Dawson High School and Valley View Seventh-day Adventist School.
Ownership History
Date
Name
Owned For
Owner Type
Purchase Details
Closed on
Jun 3, 2025
Sold by
Federal Home Loan Mtg Corp
Bought by
Beeler Clifford
Current Estimated Value
Home Financials for this Owner
Home Financials are based on the most recent Mortgage that was taken out on this home.
Original Mortgage
$79,900
Outstanding Balance
$78,497
Interest Rate
0.68%
Mortgage Type
New Conventional
Estimated Equity
$82,797
Purchase Details
Closed on
Aug 31, 2015
Sold by
Goroski Bryon D
Bought by
Mcfarland Roseann L
Home Financials for this Owner
Home Financials are based on the most recent Mortgage that was taken out on this home.
Original Mortgage
$104,000
Interest Rate
4.05%
Mortgage Type
New Conventional
Create a Home Valuation Report for This Property
The Home Valuation Report is an in-depth analysis detailing your home's value as well as a comparison with similar homes in the area
Home Values in the Area
Average Home Value in this Area
Purchase History
| Date | Buyer | Sale Price | Title Company |
|---|---|---|---|
| Beeler Clifford | $129,900 | Title 365 | |
| Mcfarland Roseann L | $130,000 | First American Title |
Source: Public Records
Mortgage History
| Date | Status | Borrower | Loan Amount |
|---|---|---|---|
| Open | Beeler Clifford | $79,900 | |
| Previous Owner | Mcfarland Roseann L | $104,000 |
Source: Public Records
Tax History
| Year | Tax Paid | Tax Assessment Tax Assessment Total Assessment is a certain percentage of the fair market value that is determined by local assessors to be the total taxable value of land and additions on the property. | Land | Improvement |
|---|---|---|---|---|
| 2025 | $2,126 | $131,800 | $0 | $0 |
| 2024 | $2,525 | $113,600 | $0 | $0 |
| 2023 | $2,677 | $113,600 | $0 | $0 |
| 2022 | $2,510 | $99,500 | $0 | $0 |
| 2021 | $897 | $99,500 | $0 | $0 |
| 2020 | $1,559 | $93,700 | $0 | $0 |
| 2019 | $1,544 | $93,700 | $0 | $0 |
| 2018 | $2,258 | $124,100 | $0 | $0 |
| 2017 | $1,094 | $124,100 | $0 | $0 |
| 2016 | $2,299 | $117,100 | $0 | $0 |
| 2015 | $1,140 | $117,100 | $0 | $0 |
| 2014 | $499 | $28,885 | $0 | $0 |
Source: Public Records
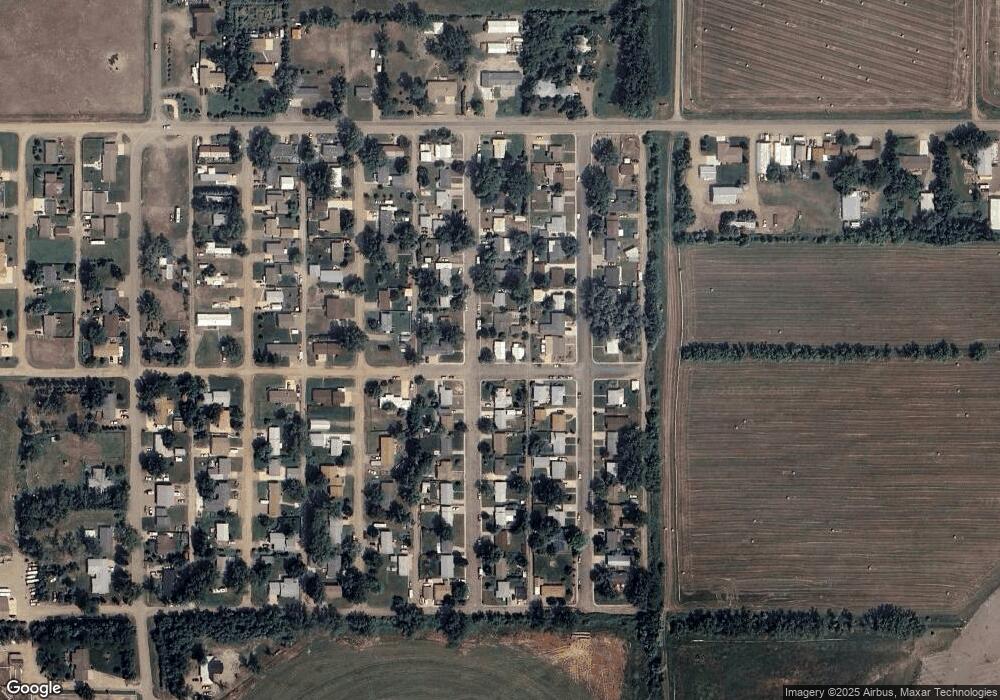
Map
Nearby Homes
Your Personal Tour Guide
Ask me questions while you tour the home.