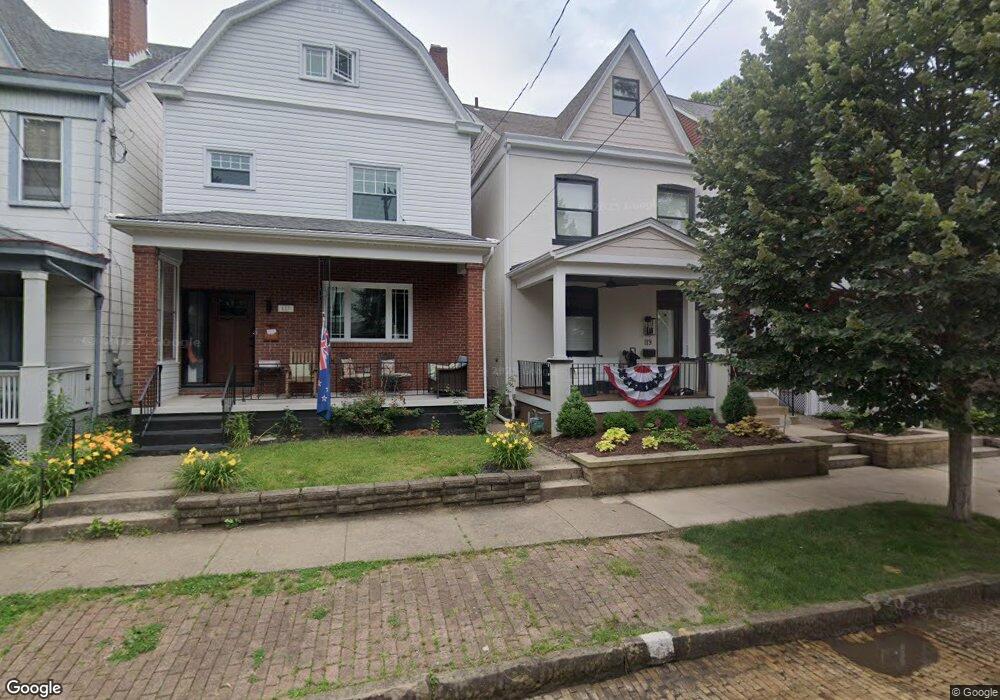
119 3rd St Aspinwall, PA 15215
Estimated Value: $399,000 - $442,013
3
Beds
2
Baths
1,608
Sq Ft
$262/Sq Ft
Est. Value
About This Home
This home is located at 119 3rd St, Aspinwall, PA 15215 and is currently estimated at $421,753, approximately $262 per square foot. 119 3rd St is a home located in Allegheny County with nearby schools including Fox Chapel Area High School, Catalyst Academy Charter School, and Christ The Divine Teacher Catholic Academy.
Ownership History
Date
Name
Owned For
Owner Type
Purchase Details
Closed on
Jul 12, 2017
Sold by
Dupepe Michele
Bought by
Palmer William A and Palmer Lauren
Current Estimated Value
Home Financials for this Owner
Home Financials are based on the most recent Mortgage that was taken out on this home.
Original Mortgage
$266,000
Outstanding Balance
$221,304
Interest Rate
3.94%
Mortgage Type
New Conventional
Estimated Equity
$200,449
Purchase Details
Closed on
Oct 19, 1990
Bought by
Dupepe Michele
Create a Home Valuation Report for This Property
The Home Valuation Report is an in-depth analysis detailing your home's value as well as a comparison with similar homes in the area
Home Values in the Area
Average Home Value in this Area
Purchase History
| Date | Buyer | Sale Price | Title Company |
|---|---|---|---|
| Palmer William A | $280,000 | Attorney | |
| Dupepe Michele | $70,000 | -- |
Source: Public Records
Mortgage History
| Date | Status | Borrower | Loan Amount |
|---|---|---|---|
| Open | Palmer William A | $266,000 |
Source: Public Records
Tax History Compared to Growth
Tax History
| Year | Tax Paid | Tax Assessment Tax Assessment Total Assessment is a certain percentage of the fair market value that is determined by local assessors to be the total taxable value of land and additions on the property. | Land | Improvement |
|---|---|---|---|---|
| 2025 | $7,601 | $224,700 | $75,000 | $149,700 |
| 2024 | $7,601 | $224,700 | $75,000 | $149,700 |
| 2023 | $7,195 | $224,700 | $75,000 | $149,700 |
| 2022 | $7,127 | $224,700 | $75,000 | $149,700 |
| 2021 | $1,063 | $224,700 | $75,000 | $149,700 |
| 2020 | $7,003 | $224,700 | $75,000 | $149,700 |
| 2019 | $7,626 | $224,700 | $75,000 | $149,700 |
| 2018 | $794 | $167,900 | $75,000 | $92,900 |
| 2017 | $4,433 | $149,900 | $75,000 | $74,900 |
| 2016 | $709 | $149,900 | $75,000 | $74,900 |
| 2015 | $709 | $149,900 | $75,000 | $74,900 |
| 2014 | $4,230 | $149,900 | $75,000 | $74,900 |
Source: Public Records
Map
Nearby Homes