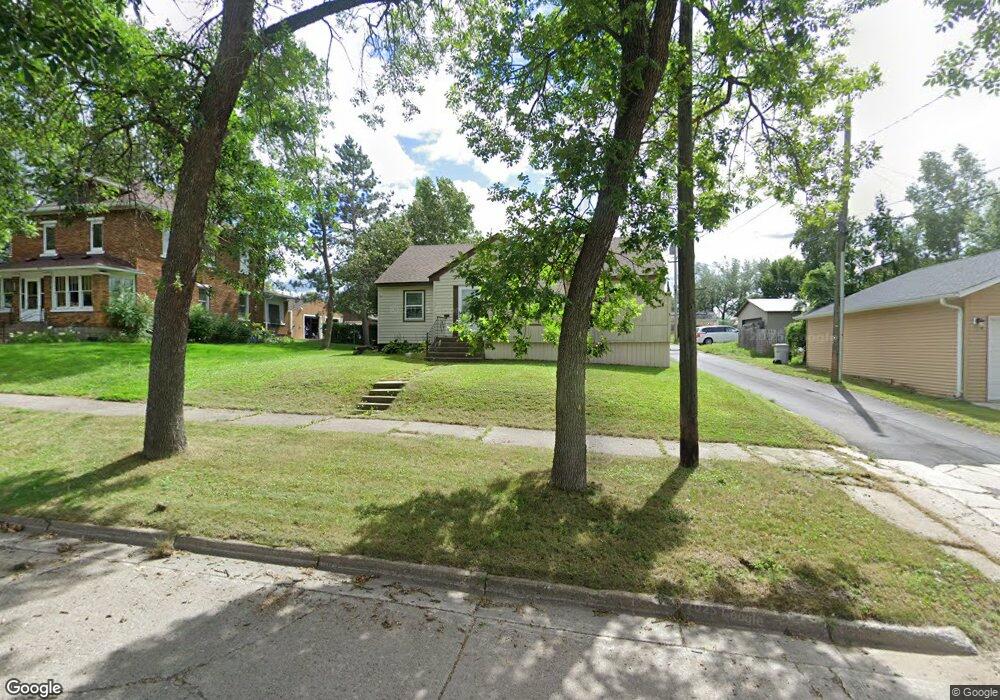
119 3rd St NW Chisholm, MN 55719
Estimated Value: $110,000 - $139,691
2
Beds
1
Bath
952
Sq Ft
$135/Sq Ft
Est. Value
About This Home
This home is located at 119 3rd St NW, Chisholm, MN 55719 and is currently estimated at $128,173, approximately $134 per square foot. 119 3rd St NW is a home located in St. Louis County with nearby schools including Vaughan Elementary School, Chisholm Elementary School, and Chisholm Secondary School.
Ownership History
Date
Name
Owned For
Owner Type
Purchase Details
Closed on
Dec 12, 2005
Sold by
Vandyke Roger J
Bought by
Silcox Jodie and Silcox Van Dyke
Current Estimated Value
Purchase Details
Closed on
Mar 8, 2002
Sold by
Nettle John P
Bought by
Laughlin Jodie L
Home Financials for this Owner
Home Financials are based on the most recent Mortgage that was taken out on this home.
Original Mortgage
$38,000
Interest Rate
7.25%
Create a Home Valuation Report for This Property
The Home Valuation Report is an in-depth analysis detailing your home's value as well as a comparison with similar homes in the area
Home Values in the Area
Average Home Value in this Area
Purchase History
| Date | Buyer | Sale Price | Title Company |
|---|---|---|---|
| Silcox Jodie | -- | None Available | |
| Laughlin Jodie L | -- | -- |
Source: Public Records
Mortgage History
| Date | Status | Borrower | Loan Amount |
|---|---|---|---|
| Previous Owner | Laughlin Jodie L | $38,000 |
Source: Public Records
Tax History Compared to Growth
Tax History
| Year | Tax Paid | Tax Assessment Tax Assessment Total Assessment is a certain percentage of the fair market value that is determined by local assessors to be the total taxable value of land and additions on the property. | Land | Improvement |
|---|---|---|---|---|
| 2024 | $1,476 | $131,000 | $7,100 | $123,900 |
| 2023 | $1,476 | $124,300 | $7,100 | $117,200 |
| 2022 | $594 | $96,100 | $5,400 | $90,700 |
| 2021 | $666 | $79,700 | $3,300 | $76,400 |
| 2020 | $612 | $79,700 | $3,300 | $76,400 |
| 2019 | $544 | $79,700 | $3,300 | $76,400 |
| 2018 | $492 | $74,600 | $3,300 | $71,300 |
| 2017 | $620 | $74,500 | $3,200 | $71,300 |
| 2016 | $580 | $82,300 | $4,700 | $77,600 |
| 2015 | $585 | $43,100 | $2,800 | $40,300 |
| 2014 | $585 | $42,700 | $2,800 | $39,900 |
Source: Public Records
Map
Nearby Homes