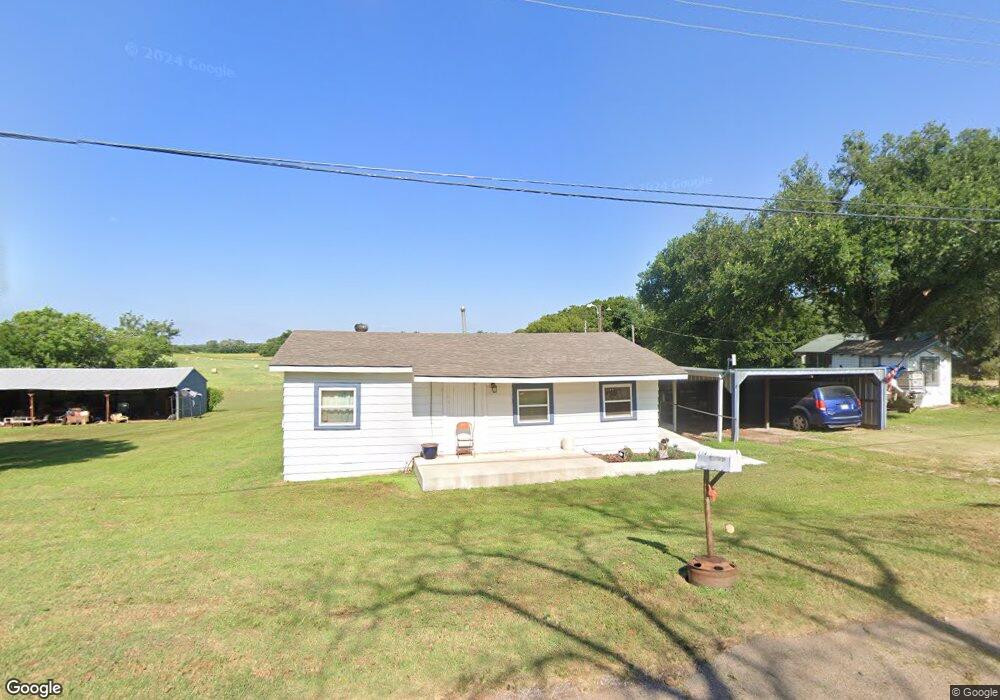
119 Division St Arcadia, OK 73007
East Edmond NeighborhoodEstimated Value: $161,620 - $246,000
3
Beds
1
Bath
1,040
Sq Ft
$197/Sq Ft
Est. Value
About This Home
This home is located at 119 Division St, Arcadia, OK 73007 and is currently estimated at $204,905, approximately $197 per square foot. 119 Division St is a home with nearby schools including Will Rogers Elementary School, Central Middle School, and Memorial High School.
Ownership History
Date
Name
Owned For
Owner Type
Purchase Details
Closed on
Mar 23, 2021
Sold by
Hatchel Ernest D and Hatchel Sam
Bought by
Hatchel Ernest D and Hatchel Sam
Current Estimated Value
Purchase Details
Closed on
Mar 4, 2021
Sold by
Kennemer Todd
Bought by
Hatchel Ernest D
Purchase Details
Closed on
Sep 11, 2017
Sold by
Hatchel Ernest D and Hatchel Sam
Bought by
Hatchel Ernest D and Hatchel Sam
Purchase Details
Closed on
Sep 7, 2017
Sold by
Hatchel Mike
Bought by
Hatchel Ernest D and Hatchel Sam
Purchase Details
Closed on
Dec 13, 2012
Sold by
Hatchel Ernest D
Bought by
Hatchel Ernest D and Hatchel Sam
Create a Home Valuation Report for This Property
The Home Valuation Report is an in-depth analysis detailing your home's value as well as a comparison with similar homes in the area
Home Values in the Area
Average Home Value in this Area
Purchase History
| Date | Buyer | Sale Price | Title Company |
|---|---|---|---|
| Hatchel Ernest D | -- | None Available | |
| Hatchel Ernest D | -- | None Available | |
| Hatchel Ernest D | -- | Os Title | |
| Hatchel Ernest D | -- | Os Title | |
| Hatchel Ernest D | -- | None Available |
Source: Public Records
Tax History Compared to Growth
Tax History
| Year | Tax Paid | Tax Assessment Tax Assessment Total Assessment is a certain percentage of the fair market value that is determined by local assessors to be the total taxable value of land and additions on the property. | Land | Improvement |
|---|---|---|---|---|
| 2024 | -- | $7,470 | $2,302 | $5,168 |
| 2023 | $0 | $7,253 | $951 | $6,302 |
| 2022 | -- | $7,042 | $1,048 | $5,994 |
| 2021 | $0 | $6,837 | $1,379 | $5,458 |
| 2020 | $0 | $6,638 | $1,450 | $5,188 |
| 2019 | $518 | $6,445 | $351 | $6,094 |
| 2018 | $0 | $6,258 | $0 | $0 |
| 2017 | $0 | $6,075 | $329 | $5,746 |
| 2016 | $518 | $5,898 | $415 | $5,483 |
| 2015 | $500 | $5,726 | $395 | $5,331 |
| 2014 | $481 | $5,559 | $383 | $5,176 |
Source: Public Records
Map
Nearby Homes