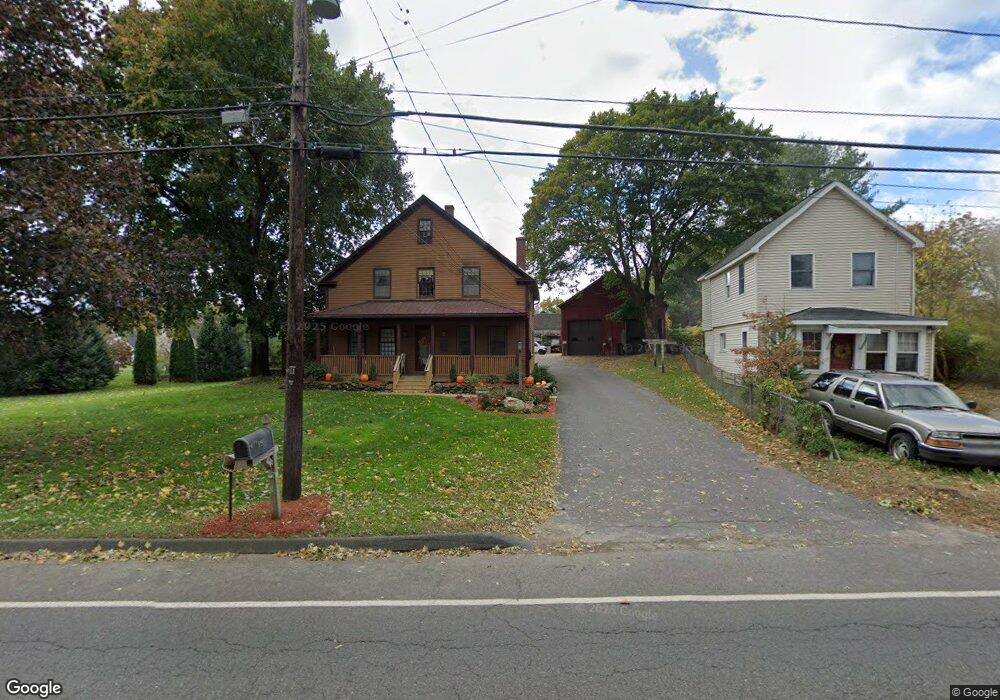
119 Elm St Hatfield, MA 01038
Estimated Value: $504,000 - $738,000
7
Beds
3
Baths
4,176
Sq Ft
$149/Sq Ft
Est. Value
About This Home
This home is located at 119 Elm St, Hatfield, MA 01038 and is currently estimated at $621,000, approximately $148 per square foot. 119 Elm St is a home located in Hampshire County with nearby schools including Hatfield Elementary School, Smith Academy, and The Montessori School of Northampton.
Ownership History
Date
Name
Owned For
Owner Type
Purchase Details
Closed on
Oct 18, 2021
Sold by
Tucker Jill C and Larareo Cynthia
Bought by
119 Realty Llc
Current Estimated Value
Purchase Details
Closed on
Oct 15, 2021
Sold by
Symanski Stanley L Est
Bought by
Tucker Jill C and Larareo Cynthia
Purchase Details
Closed on
Jun 12, 1998
Sold by
Mientke Margaret A
Bought by
Symanski Stanley L
Home Financials for this Owner
Home Financials are based on the most recent Mortgage that was taken out on this home.
Original Mortgage
$125,000
Interest Rate
7.11%
Mortgage Type
Purchase Money Mortgage
Create a Home Valuation Report for This Property
The Home Valuation Report is an in-depth analysis detailing your home's value as well as a comparison with similar homes in the area
Home Values in the Area
Average Home Value in this Area
Purchase History
| Date | Buyer | Sale Price | Title Company |
|---|---|---|---|
| 119 Realty Llc | -- | None Available | |
| Tucker Jill C | -- | None Available | |
| Symanski Stanley L | $78,000 | -- |
Source: Public Records
Mortgage History
| Date | Status | Borrower | Loan Amount |
|---|---|---|---|
| Previous Owner | Symanski Stanley L | $300,000 | |
| Previous Owner | Symanski Stanley L | $125,000 |
Source: Public Records
Tax History
| Year | Tax Paid | Tax Assessment Tax Assessment Total Assessment is a certain percentage of the fair market value that is determined by local assessors to be the total taxable value of land and additions on the property. | Land | Improvement |
|---|---|---|---|---|
| 2025 | $10,997 | $794,600 | $167,100 | $627,500 |
| 2024 | $11,547 | $754,200 | $146,100 | $608,100 |
| 2023 | $9,584 | $711,000 | $138,500 | $572,500 |
| 2022 | $9,245 | $676,300 | $131,800 | $544,500 |
| 2021 | $9,277 | $653,800 | $120,500 | $533,300 |
| 2020 | $8,846 | $653,800 | $120,500 | $533,300 |
| 2019 | $8,509 | $612,600 | $118,300 | $494,300 |
| 2018 | $7,508 | $552,900 | $118,300 | $434,600 |
| 2017 | $7,223 | $546,400 | $118,300 | $428,100 |
| 2016 | $7,167 | $543,800 | $118,300 | $425,500 |
| 2015 | $6,511 | $494,400 | $107,000 | $387,400 |
| 2014 | -- | $495,100 | $107,000 | $388,100 |
Source: Public Records
Map
Nearby Homes
- 12 Dwight St
- 18 Elm St
- 32 Stonewall Dr
- 80 Damon Rd Unit 5104
- 80 Damon Rd Unit 4302
- 88 Pines Edge Dr Unit 88
- 0 N Branch Rd
- 26 Russell St Unit A-B
- 11 West St
- 289 Hatfield St
- 58 Main St Unit 4
- 58 Main St Unit 3
- 35 Hubbard Ave
- 22 Woodbine Ave
- 182 Old Stage Rd
- 20 View Ave Unit A
- 30 View Ave
- 0 Terrace Ln
- 0 Straits Rd
- 575 Bridge Rd Unit 12-7
- 121 Elm St
- 125 Elm St
- 123 Elm St
- 115 Elm St Unit 6A
- 115 Elm St Unit 14B
- 115 Elm St Unit 14A
- 115 Elm St Unit 8B
- 115 Elm St Unit 8A
- 115 Elm St Unit 6B
- 115 Elm St Unit 4B
- 115 Elm St Unit 4A
- 115 Elm St Unit 2B
- 115 Elm St Unit 2A
- 115 Elm St Unit 21B
- 115 Elm St Unit 20A
- 115 Elm St Unit 20B
- 115 Elm St Unit 22B
- 115 Elm St Unit 22A
- 115 Elm St
- 115 Elm St Unit 19A
Your Personal Tour Guide
Ask me questions while you tour the home.