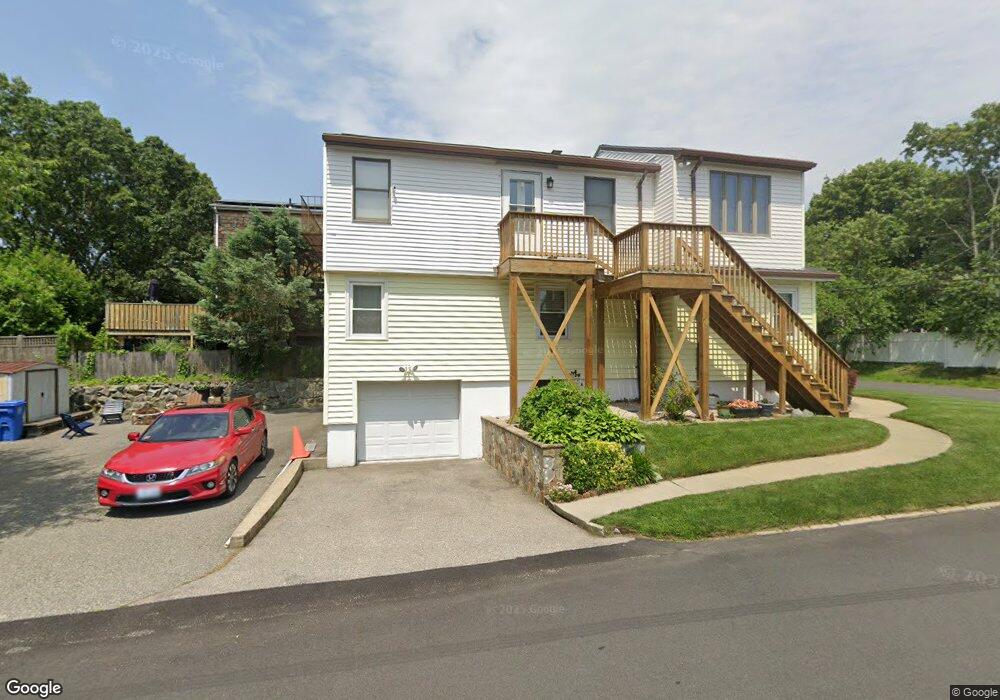
119 Frankfort St Cranston, RI 02910
Spectacle NeighborhoodEstimated Value: $452,884 - $539,000
5
Beds
3
Baths
2,192
Sq Ft
$233/Sq Ft
Est. Value
About This Home
This home is located at 119 Frankfort St, Cranston, RI 02910 and is currently estimated at $510,471, approximately $232 per square foot. 119 Frankfort St is a home located in Providence County with nearby schools including Stadium Elementary School, Hugh B. Bain Middle School, and Cranston High School East.
Ownership History
Date
Name
Owned For
Owner Type
Purchase Details
Closed on
Jul 18, 2013
Sold by
Ri Hsng & Mtg Fin Corp
Bought by
Carrillo Ignacio and Carrillo Evelyn
Current Estimated Value
Purchase Details
Closed on
Aug 24, 2006
Sold by
Seng Min T
Bought by
Carrillo Evelyn and Carrillo Ignacio
Home Financials for this Owner
Home Financials are based on the most recent Mortgage that was taken out on this home.
Original Mortgage
$287,560
Interest Rate
6.83%
Mortgage Type
Purchase Money Mortgage
Purchase Details
Closed on
Oct 12, 1993
Sold by
Williams Timothy M
Bought by
Seng Phat K and Seng Teu Thang
Create a Home Valuation Report for This Property
The Home Valuation Report is an in-depth analysis detailing your home's value as well as a comparison with similar homes in the area
Home Values in the Area
Average Home Value in this Area
Purchase History
| Date | Buyer | Sale Price | Title Company |
|---|---|---|---|
| Carrillo Ignacio | $50,000 | -- | |
| Carrillo Evelyn | $280,000 | -- | |
| Seng Phat K | $105,000 | -- |
Source: Public Records
Mortgage History
| Date | Status | Borrower | Loan Amount |
|---|---|---|---|
| Previous Owner | Seng Phat K | $287,560 | |
| Previous Owner | Seng Phat K | $204,000 | |
| Previous Owner | Seng Phat K | $189,000 | |
| Previous Owner | Seng Phat K | $97,694 |
Source: Public Records
Tax History Compared to Growth
Tax History
| Year | Tax Paid | Tax Assessment Tax Assessment Total Assessment is a certain percentage of the fair market value that is determined by local assessors to be the total taxable value of land and additions on the property. | Land | Improvement |
|---|---|---|---|---|
| 2025 | $5,143 | $370,500 | $95,700 | $274,800 |
| 2024 | $5,043 | $370,500 | $95,700 | $274,800 |
| 2023 | $4,810 | $254,500 | $66,000 | $188,500 |
| 2022 | $4,711 | $254,500 | $66,000 | $188,500 |
| 2021 | $4,581 | $254,500 | $66,000 | $188,500 |
| 2020 | $4,409 | $212,300 | $62,700 | $149,600 |
| 2019 | $4,409 | $212,300 | $62,700 | $149,600 |
| 2018 | $4,308 | $212,300 | $62,700 | $149,600 |
| 2017 | $3,730 | $162,600 | $46,200 | $116,400 |
| 2016 | $3,650 | $162,600 | $46,200 | $116,400 |
| 2015 | $3,650 | $162,600 | $46,200 | $116,400 |
| 2014 | $3,483 | $152,500 | $46,200 | $106,300 |
Source: Public Records
Map
Nearby Homes