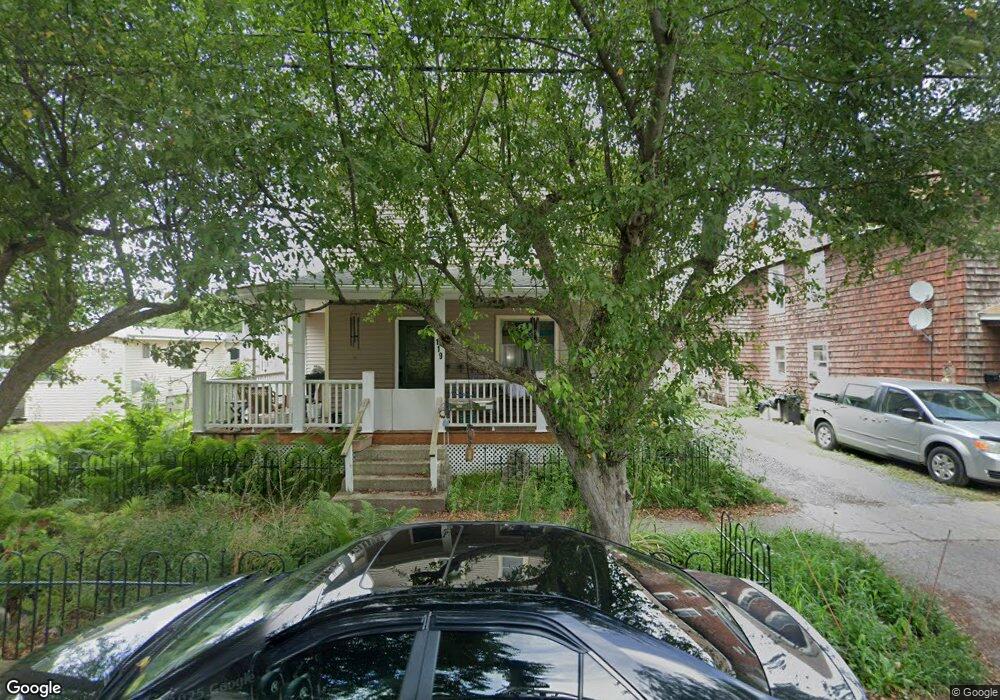
119 Gibson Ave Rutland, VT 05701
Estimated Value: $122,000 - $219,000
--
Bed
--
Bath
--
Sq Ft
7,405
Sq Ft Lot
About This Home
This home is located at 119 Gibson Ave, Rutland, VT 05701 and is currently estimated at $191,793. 119 Gibson Ave is a home located in Rutland County with nearby schools including Rutland Intermediate School, Rutland Middle School, and Rutland Senior High School.
Ownership History
Date
Name
Owned For
Owner Type
Purchase Details
Closed on
Jun 25, 2013
Sold by
Pike Steven J and Pike Lovett Sandra
Bought by
Pike Lovett Sandra and Lovett Donald R
Current Estimated Value
Purchase Details
Closed on
Feb 9, 1988
Sold by
Aurora Properties Inc
Bought by
Dulcan Mary Ann
Purchase Details
Closed on
Dec 4, 1987
Sold by
Aurora Properties Inc
Bought by
Howard Christine C and Sheets Martha L
Purchase Details
Closed on
Jul 8, 1987
Sold by
Gipe James D
Bought by
Aurora Properties Inc
Create a Home Valuation Report for This Property
The Home Valuation Report is an in-depth analysis detailing your home's value as well as a comparison with similar homes in the area
Home Values in the Area
Average Home Value in this Area
Purchase History
| Date | Buyer | Sale Price | Title Company |
|---|---|---|---|
| Pike Lovett Sandra | -- | -- | |
| Pike Lovett Sandra | -- | -- | |
| Dulcan Mary Ann | $77,000 | -- | |
| Howard Christine C | $20,000 | -- | |
| Aurora Properties Inc | $67,000 | -- | |
| Dulcan Mary Ann | $77,000 | -- | |
| Howard Christine C | $20,000 | -- | |
| Aurora Properties Inc | $67,000 | -- |
Source: Public Records
Tax History Compared to Growth
Tax History
| Year | Tax Paid | Tax Assessment Tax Assessment Total Assessment is a certain percentage of the fair market value that is determined by local assessors to be the total taxable value of land and additions on the property. | Land | Improvement |
|---|---|---|---|---|
| 2024 | -- | $118,600 | $28,500 | $90,100 |
| 2023 | -- | $114,800 | $28,500 | $86,300 |
| 2022 | $3,230 | $114,800 | $28,500 | $86,300 |
| 2021 | $3,270 | $114,800 | $28,500 | $86,300 |
| 2020 | $3,191 | $114,800 | $28,500 | $86,300 |
| 2019 | $3,129 | $114,800 | $28,500 | $86,300 |
| 2018 | $3,209 | $114,800 | $28,500 | $86,300 |
| 2017 | $2,947 | $114,800 | $28,500 | $86,300 |
| 2016 | $3,561 | $114,800 | $28,500 | $86,300 |
Source: Public Records
Map
Nearby Homes