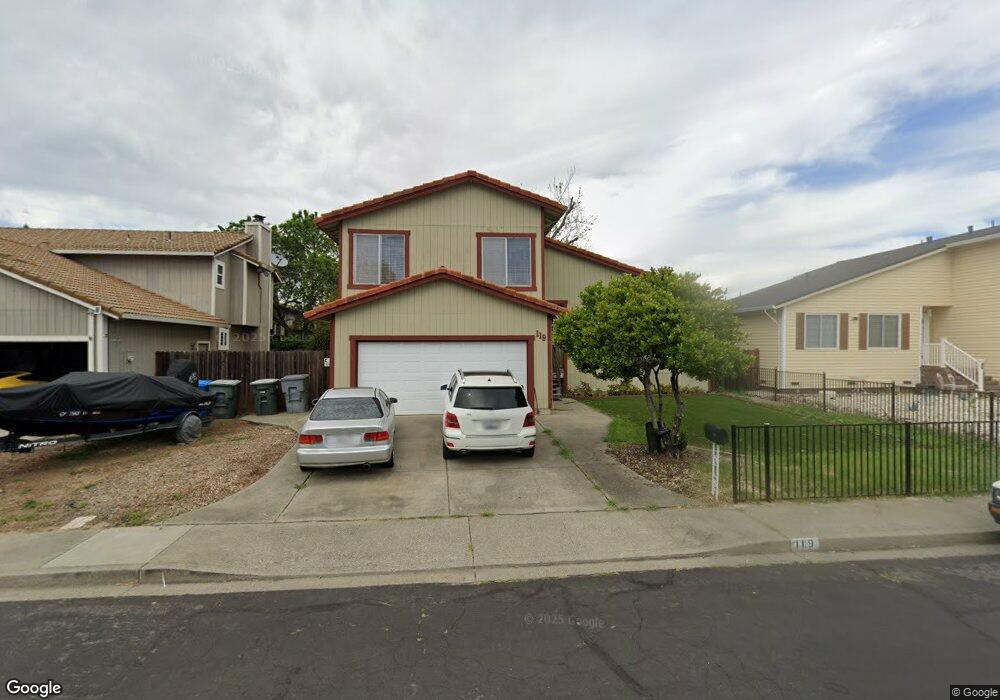
119 Glasgow Way Vacaville, CA 95687
Estimated Value: $550,000 - $621,000
4
Beds
3
Baths
2,015
Sq Ft
$293/Sq Ft
Est. Value
About This Home
This home is located at 119 Glasgow Way, Vacaville, CA 95687 and is currently estimated at $590,103, approximately $292 per square foot. 119 Glasgow Way is a home located in Solano County with nearby schools including Jean Callison Elementary School, Orchard Elementary School, and Vaca Pena Middle School.
Ownership History
Date
Name
Owned For
Owner Type
Purchase Details
Closed on
Jun 4, 1999
Sold by
Gonzalez Michael J and Gonzalez Dawn E
Bought by
Loveland Esther
Current Estimated Value
Home Financials for this Owner
Home Financials are based on the most recent Mortgage that was taken out on this home.
Original Mortgage
$186,463
Outstanding Balance
$48,569
Interest Rate
6.9%
Mortgage Type
FHA
Estimated Equity
$541,534
Purchase Details
Closed on
May 28, 1999
Sold by
Loveland Eric C
Bought by
Loveland Esther G
Home Financials for this Owner
Home Financials are based on the most recent Mortgage that was taken out on this home.
Original Mortgage
$186,463
Outstanding Balance
$48,569
Interest Rate
6.9%
Mortgage Type
FHA
Estimated Equity
$541,534
Purchase Details
Closed on
May 19, 1998
Sold by
Gonzalez Michael J
Bought by
Gonzalez Michael J and Gonzalez Dawn L
Purchase Details
Closed on
Aug 27, 1997
Sold by
Beamon Gilton Barbara A
Bought by
Gonzalez Michael J
Create a Home Valuation Report for This Property
The Home Valuation Report is an in-depth analysis detailing your home's value as well as a comparison with similar homes in the area
Home Values in the Area
Average Home Value in this Area
Purchase History
| Date | Buyer | Sale Price | Title Company |
|---|---|---|---|
| Loveland Esther | $188,000 | Placer Title Company | |
| Loveland Esther G | -- | Placer Title Company | |
| Gonzalez Michael J | -- | -- | |
| Gonzalez Michael J | -- | -- |
Source: Public Records
Mortgage History
| Date | Status | Borrower | Loan Amount |
|---|---|---|---|
| Open | Loveland Esther | $186,463 |
Source: Public Records
Tax History Compared to Growth
Tax History
| Year | Tax Paid | Tax Assessment Tax Assessment Total Assessment is a certain percentage of the fair market value that is determined by local assessors to be the total taxable value of land and additions on the property. | Land | Improvement |
|---|---|---|---|---|
| 2025 | $3,394 | $294,726 | $62,705 | $232,021 |
| 2024 | $3,394 | $288,948 | $61,476 | $227,472 |
| 2023 | $3,314 | $283,283 | $60,271 | $223,012 |
| 2022 | $3,228 | $277,730 | $59,090 | $218,640 |
| 2021 | $3,234 | $272,285 | $57,932 | $214,353 |
| 2020 | $3,191 | $269,494 | $57,338 | $212,156 |
| 2019 | $3,136 | $264,211 | $56,214 | $207,997 |
| 2018 | $3,101 | $259,031 | $55,112 | $203,919 |
| 2017 | $2,999 | $253,953 | $54,032 | $199,921 |
| 2016 | $2,981 | $248,974 | $52,973 | $196,001 |
| 2015 | $2,942 | $245,235 | $52,178 | $193,057 |
| 2014 | $2,757 | $240,432 | $51,156 | $189,276 |
Source: Public Records
Map
Nearby Homes
- 1055 Woodridge Dr
- 1084 Woodridge Dr
- 163 Stirling Dr
- 1136 Woodridge Dr
- 128 Clark Way
- 1801 Marshall Rd Unit 408
- 1801 Marshall Rd Unit 908
- 1801 Marshall Rd Unit 705
- 190 Fairview Dr
- 190 Huntington Dr
- 512 Oakmeadow Ct
- 642 White Oak Ln
- 3642 Alamo Dr
- 122 Village Ct
- 2600 Nut Tree Rd
- 332 Plantation Ct
- 106 Village Ct
- 719 Beelard Dr
- 854 Owl Cir
- 390 Claridge Ct
- 125 Glasgow Way
- 113 Glasgow Way
- 136 Edinburgh Way
- 124 Edinburgh Way
- 131 Glasgow Way
- 100 Melrose Ct
- 107 Glasgow Way
- 142 Edinburgh Way
- 118 Edinburgh Way
- 106 Glasgow Way
- 137 Glasgow Way
- 106 Melrose Ct
- 112 Edinburgh Way
- 148 Melrose Ct
- 101 Glasgow Way
- 100 Glasgow Way
- 143 Glasgow Way
- 131 Edinburgh Way
- 137 Edinburgh Way