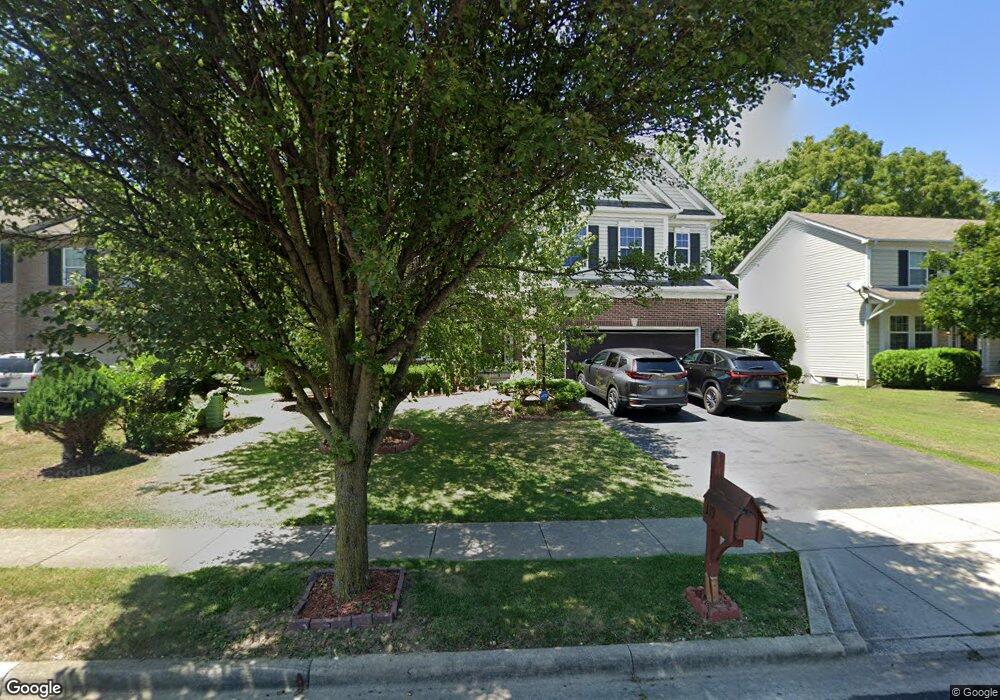
119 Leasure Dr Unit LA05 Pickerington, OH 43147
Estimated Value: $487,679 - $502,000
4
Beds
4
Baths
2,977
Sq Ft
$166/Sq Ft
Est. Value
About This Home
This home is located at 119 Leasure Dr Unit LA05, Pickerington, OH 43147 and is currently estimated at $494,420, approximately $166 per square foot. 119 Leasure Dr Unit LA05 is a home located in Fairfield County with nearby schools including Pickerington Elementary School, Diley Middle School, and Pickerington Ridgeview Junior High School.
Ownership History
Date
Name
Owned For
Owner Type
Purchase Details
Closed on
Sep 24, 2021
Sold by
Polakowski Raymond F and Polakowski Maureen R
Bought by
Majhi Deelip and Gurung Tirtha K
Current Estimated Value
Home Financials for this Owner
Home Financials are based on the most recent Mortgage that was taken out on this home.
Original Mortgage
$340,000
Interest Rate
2.99%
Mortgage Type
New Conventional
Purchase Details
Closed on
Mar 30, 2011
Sold by
Long John W and Long Melanie A
Bought by
Polakowski Raymond F and Polakowski Maureen R
Purchase Details
Closed on
Mar 17, 2008
Sold by
Beazer Homes Investments Llc
Bought by
Long John W and Long Melanie A
Home Financials for this Owner
Home Financials are based on the most recent Mortgage that was taken out on this home.
Original Mortgage
$200,800
Interest Rate
5.74%
Mortgage Type
Purchase Money Mortgage
Create a Home Valuation Report for This Property
The Home Valuation Report is an in-depth analysis detailing your home's value as well as a comparison with similar homes in the area
Home Values in the Area
Average Home Value in this Area
Purchase History
| Date | Buyer | Sale Price | Title Company |
|---|---|---|---|
| Majhi Deelip | -- | None Listed On Document | |
| Polakowski Raymond F | $228,000 | Title First Agency Inc | |
| Long John W | $251,000 | Preferred Title & Guaranty A |
Source: Public Records
Mortgage History
| Date | Status | Borrower | Loan Amount |
|---|---|---|---|
| Previous Owner | Majhi Deelip | $340,000 | |
| Previous Owner | Long John W | $200,800 |
Source: Public Records
Tax History Compared to Growth
Tax History
| Year | Tax Paid | Tax Assessment Tax Assessment Total Assessment is a certain percentage of the fair market value that is determined by local assessors to be the total taxable value of land and additions on the property. | Land | Improvement |
|---|---|---|---|---|
| 2024 | $15,960 | $129,650 | $16,560 | $113,090 |
| 2023 | $6,112 | $129,650 | $16,560 | $113,090 |
| 2022 | $6,132 | $129,650 | $16,560 | $113,090 |
| 2021 | $5,475 | $98,570 | $13,890 | $84,680 |
| 2020 | $5,535 | $98,570 | $13,890 | $84,680 |
| 2019 | $5,569 | $98,570 | $13,890 | $84,680 |
| 2018 | $5,548 | $89,860 | $12,500 | $77,360 |
| 2017 | $5,556 | $85,600 | $12,620 | $72,980 |
| 2016 | $5,528 | $85,600 | $12,620 | $72,980 |
| 2015 | $5,559 | $81,380 | $10,010 | $71,370 |
| 2014 | $5,491 | $81,380 | $10,010 | $71,370 |
| 2013 | $5,491 | $81,380 | $10,010 | $71,370 |
Source: Public Records
Map
Nearby Homes
- 144 Monebrake Dr
- 248 Pioneer Cir Unit 248
- 104 Monebrake Dr
- 113 Urich Dr
- Pendleton Plan at Longview Highlands
- Stamford Plan at Longview Highlands
- Bellamy Plan at Longview Highlands
- Newcastle Plan at Longview Highlands
- Chatham Plan at Longview Highlands
- Sienna Plan at Longview Highlands
- Harmony Plan at Longview Highlands
- Henley Plan at Longview Highlands
- 136 Pioneer Cir
- 165 Balderson Dr
- 352 Evergreen Cir
- 87 Knights Bridge Dr W
- 291 Sterndale Dr
- 167 Lorrimore Dr
- 144 Lorrimore Dr
- 145 Lorrimore Dr
- 119 Leasure Dr
- 115 Leasure Dr
- 115 Leasure Dr
- 115 Leasure Dr Unit 4
- 123 Leasure Dr
- 111 Leasure Dr
- 111 Leasure Dr Unit LA03
- 127 Leasure Dr
- 104 Leasure Dr
- 108 Leasure Dr
- 116 Leasure Dr
- 107 Leasure Dr
- 131 Leasure Dr
- 112 Leasure Dr
- 120 Leasure Dr
- 103 Leasure Dr
- 103 Leasure Dr Unit 1
- 135 Leasure Dr
- 124 Leasure Dr
- 124 Leasure Dr Unit 49